HOT TOPICS LIST
- MACD
- Fibonacci
- RSI
- Gann
- ADXR
- Stochastics
- Volume
- Triangles
- Futures
- Cycles
- Volatility
- ZIGZAG
- MESA
- Retracement
- Aroon
INDICATORS LIST
LIST OF TOPICS
PRINT THIS ARTICLE
by Jayanthi Gopalakrishnan
Qualcomm, Inc. (QCOM) offered a few good trading opportunities on 5/30/00. Considering that the broader indices were up and QCOM was one of the most actively traded stocks on the Nasdaq, it was certainly one to consider trading.
Position: Buy
Jayanthi Gopalakrishnan
PRINT THIS ARTICLE
DAY TRADING
Trade Of The Day
05/30/00 03:45:02 PMby Jayanthi Gopalakrishnan
Qualcomm, Inc. (QCOM) offered a few good trading opportunities on 5/30/00. Considering that the broader indices were up and QCOM was one of the most actively traded stocks on the Nasdaq, it was certainly one to consider trading.
Position: Buy
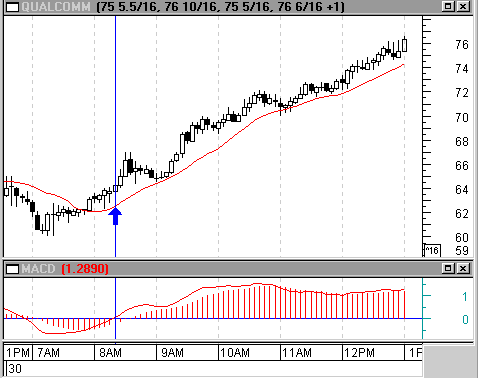
| The chart shown below is QCOM's intraday chart for May 30, 2000. The first signs that this stock was entering a profitable play came around 8:00 am (pst), when prices showed signs of reversing above their 15-period moving average (MA). When this happens, I prefer to wait for the MA to display a positive slope. If the MA is sloping up and prices remain above it, it's an indication that a trend is beginning. It's important to determine whether a stock is trending or moving within a trading range since this determines which indicators to use. If the stock displays a potential to trend, I use the moving average convergence/divergence (MACD) indicator. |
| In the lower pane of the chart you can see the MACD. At around 8:20 am (pst), the MACD line crossed into positive territory, the MA was sloping upward, and prices were well above it. This alerted me to an entry point for a long position. |

|
| Using basic indicators such as moving averages can result in profitable trades. |
| Graphic provided by: MetaStock. |
| |
| If the moving average started sloping downward, prices fell below it, and the MACD started approaching the zero line, I would have exited my long position. As you can see from the chart, the MA acted as a strong support level with prices bouncing off of it. The MACD also stayed well above the zero line. The exit conditions were not met so I kept my position open. If you like to close all your positions before the market closes, you would have made a substantial profit from one round-trip trade. Or if you had used trailing stops you may have been stopped out of your position. However, you could have reentered the trade once the signals became positive and still ended up with substantial profits. |
| Utilizing basic principles of technical analysis such as moving averages can result in profitable trades. |
| Title: | Editor |
| Company: | Technical Analysis of Stocks & Commodities |
| Address: | 4757 California Ave SW |
| Seattle, WA 98116 | |
| Website: | Traders.com |
| E-mail address: | Jayanthi@traders.com |
Traders' Resource Links | |
| Charting the Stock Market: The Wyckoff Method -- Books | |
| Working-Money.com -- Online Trading Services | |
| Traders.com Advantage -- Online Trading Services | |
| Technical Analysis of Stocks & Commodities -- Publications and Newsletters | |
| Working Money, at Working-Money.com -- Publications and Newsletters | |
| Traders.com Advantage -- Publications and Newsletters | |
| Professional Traders Starter Kit -- Software | |
Click here for more information about our publications!
Comments

Request Information From Our Sponsors
- StockCharts.com, Inc.
- Candle Patterns
- Candlestick Charting Explained
- Intermarket Technical Analysis
- John Murphy on Chart Analysis
- John Murphy's Chart Pattern Recognition
- John Murphy's Market Message
- MurphyExplainsMarketAnalysis-Intermarket Analysis
- MurphyExplainsMarketAnalysis-Visual Analysis
- StockCharts.com
- Technical Analysis of the Financial Markets
- The Visual Investor
- VectorVest, Inc.
- Executive Premier Workshop
- One-Day Options Course
- OptionsPro
- Retirement Income Workshop
- Sure-Fire Trading Systems (VectorVest, Inc.)
- Trading as a Business Workshop
- VectorVest 7 EOD
- VectorVest 7 RealTime/IntraDay
- VectorVest AutoTester
- VectorVest Educational Services
- VectorVest OnLine
- VectorVest Options Analyzer
- VectorVest ProGraphics v6.0
- VectorVest ProTrader 7
- VectorVest RealTime Derby Tool
- VectorVest Simulator
- VectorVest Variator
- VectorVest Watchdog
