HOT TOPICS LIST
- MACD
- Fibonacci
- RSI
- Gann
- ADXR
- Stochastics
- Volume
- Triangles
- Futures
- Cycles
- Volatility
- ZIGZAG
- MESA
- Retracement
- Aroon
INDICATORS LIST
LIST OF TOPICS
PRINT THIS ARTICLE
by Chris Manuell
Eli Lilly has moved aggressively lower since making a yearly high in May, but it has bounced sharply in recent days as it attempts to alleviate a historically oversold position.
Position: N/A
Chris Manuell
Chris Manuell spent 7 years as a futures sales/trader for a large investment bank and more recently as a technical analyst for an independent research company. He has a bachelor of economics and graduate diploma in applied finance & investment. Currently enrolled in the CMT program with the MTA.
PRINT THIS ARTICLE
TECHNICAL ANALYSIS
Eli Lilly And The Corrective Bounce
10/28/04 02:15:41 PMby Chris Manuell
Eli Lilly has moved aggressively lower since making a yearly high in May, but it has bounced sharply in recent days as it attempts to alleviate a historically oversold position.
Position: N/A
| Eli Lilly & Co. recently joined other stocks in an aggressive bounce that has resulted from a confluence of cyclical patterns, including the tendency for prices to rally into the end of the month as we enter the seasonally bullish November to January period. In addition, on the topic of cyclical patterns, petroleum products have displayed a tendency to top out in October -- which is supportive of stocks. |
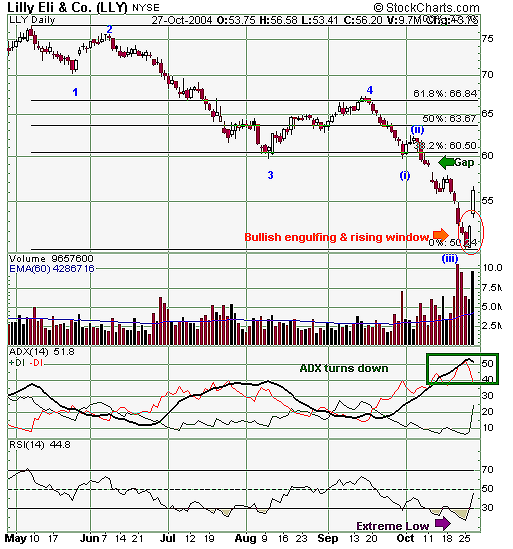
| Lilly completed a bullish engulfing pattern on October 26, which came on the back of a 52-week low made in the prior session. The bullish engulfing pattern is a bullish reversal signal that can signal a short-term bottom and stall the previous downtrend. The body of the bullish white candle must envelop the previous dark candle's body. Lilly achieved this with the opening of the session on October 26, not only engulfing the dark body of the session on October 25 but also the session prior to that. This "double-engulf," combined with the overextended weakness, heightened the significance of the pattern. The bullish engulfing pattern was confirmed the following session with a rising window, the candlestick equivalent of a bullish gap, that reinforced the impression that a short-term turning point was in place. The average directional movement index (ADX) has also turned down from the lofty 50 level, which is often a sign that the trend is coming to an end. |

|
| Figure 1: Eli Lilly daily chart |
| Graphic provided by: StockCharts.com. |
| |
| An Elliott wave count from the May peak also suggests that we have just completed wave iii in an extended wave 5--the straight line down is in character--and that a corrective wave (iv) bounce is due. This could provide short-term traders with an opportunity to enjoy a corrective bounce. Targets for a bounce could include the gap or falling window, from October 11 at 58.80. A more spirited bounce would target the prior support levels, which emerged at the end of wave 3 and wave (i), 59.78 and 59.72, respectively. The 0.382 Fibonacci level from the May to October decline at 60.50 is the top of this resistance zone. |
| The chances of another impulsive wave down to test the recent lows -- wave five of five -- is enhanced by the extreme reading in the relative strength index (RSI). In Constance Brown's exceptional book " Technical Analysis For The Trading Professional," she states that "when an oscillator successfully creates a new high or low by breaking through a former horizontal range of resistance support for that indicator, the market will have sufficient punch to come back and test the former indicator range after the new indicator extreme has been alleviated." |
Chris Manuell spent 7 years as a futures sales/trader for a large investment bank and more recently as a technical analyst for an independent research company. He has a bachelor of economics and graduate diploma in applied finance & investment. Currently enrolled in the CMT program with the MTA.
| E-mail address: | chrismanuell5@yahoo.co.uk |
Click here for more information about our publications!
Comments
Date: 10/28/04Rank: 3Comment:

Request Information From Our Sponsors
- StockCharts.com, Inc.
- Candle Patterns
- Candlestick Charting Explained
- Intermarket Technical Analysis
- John Murphy on Chart Analysis
- John Murphy's Chart Pattern Recognition
- John Murphy's Market Message
- MurphyExplainsMarketAnalysis-Intermarket Analysis
- MurphyExplainsMarketAnalysis-Visual Analysis
- StockCharts.com
- Technical Analysis of the Financial Markets
- The Visual Investor
- VectorVest, Inc.
- Executive Premier Workshop
- One-Day Options Course
- OptionsPro
- Retirement Income Workshop
- Sure-Fire Trading Systems (VectorVest, Inc.)
- Trading as a Business Workshop
- VectorVest 7 EOD
- VectorVest 7 RealTime/IntraDay
- VectorVest AutoTester
- VectorVest Educational Services
- VectorVest OnLine
- VectorVest Options Analyzer
- VectorVest ProGraphics v6.0
- VectorVest ProTrader 7
- VectorVest RealTime Derby Tool
- VectorVest Simulator
- VectorVest Variator
- VectorVest Watchdog
