HOT TOPICS LIST
- MACD
- Fibonacci
- RSI
- Gann
- ADXR
- Stochastics
- Volume
- Triangles
- Futures
- Cycles
- Volatility
- ZIGZAG
- MESA
- Retracement
- Aroon
INDICATORS LIST
LIST OF TOPICS
PRINT THIS ARTICLE
by Chris Manuell
The DJIA is making yearly lows, and because of it, there is a marked divergence with other indices.
Position: N/A
Chris Manuell
Chris Manuell spent 7 years as a futures sales/trader for a large investment bank and more recently as a technical analyst for an independent research company. He has a bachelor of economics and graduate diploma in applied finance & investment. Currently enrolled in the CMT program with the MTA.
PRINT THIS ARTICLE
TECHNICAL ANALYSIS
Three Indices And Out
10/27/04 08:36:02 AMby Chris Manuell
The DJIA is making yearly lows, and because of it, there is a marked divergence with other indices.
Position: N/A
| With the Dow Jones Industrial Average making yearly lows, there is a marked divergence with the other indices. However, a few of the peripheral indexes are developing some potential bearish reversal patterns from their August rallies. |
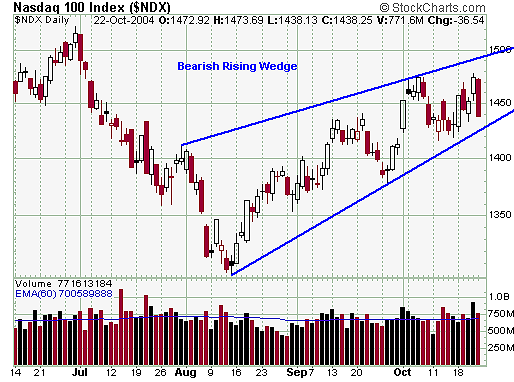
| The Nasdaq 100 (NDX) (Figure 1) has developed a potential bearish rising wedge, which is a common pattern in a bear market rally. The market has satisfied the required minimum of five touches on the converging trendlines, and a closing violation of the lower trendline would complete the pattern. A close beneath the lower trendline should result in a sharp decline and would target the bottom of the formation. This objective is in the 1300 region where the August 13th trough was formed. |

|
| Figure 1: Nasdaq 100 |
| Graphic provided by: StockCharts.com. |
| |
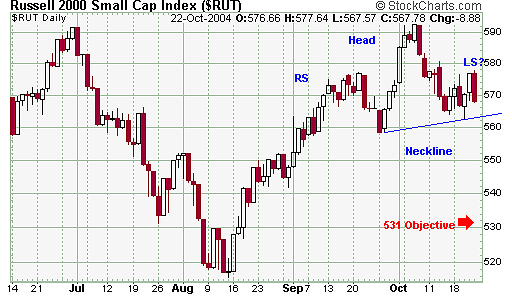
The Russell 2000 (RUT) (Figure 2) serves as a benchmark for small-cap investments and is used to measure the performance of US small company stocks. The RUT is currently developing a potential head and shoulders from its recent August rally; the head and shoulders is a reliable and recognizable pattern. The final rally is separated by two lower rallies that make up the shoulders of the formation. The potential head of the RUT emerged on October 6 as the market popped briefly above the July peak in the 590 region -- the failure to sustain the rally resulted in a correction to the neckline. The market developed a potential left shoulder last week in the 577 region, which has good symmetry with the right shoulder from mid-September. A closing violation of the upward sloping neckline in the 562 region would complete the pattern. Taking the depth of the pattern and projecting that from the breakout point can calculate a minimum objective. A completed pattern would target the 531 region.  Figure 2: Russell 2000 Small Cap Index |
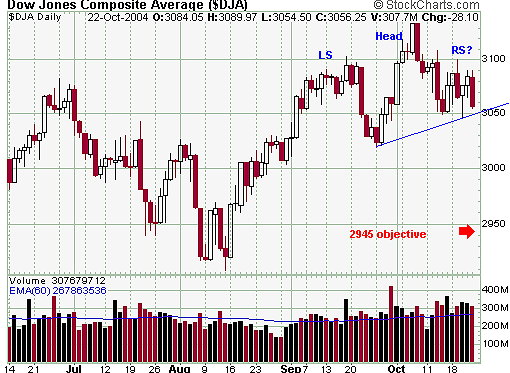
| The Dow Jones Composite Average (DJA) (Figure 3) is a broader-based index than the Dow Jones Industrial Average, with over twice the amount of components. Like the Russell 2000 index,the DJA is developing a potential head and shoulders pattern. The DJA also developed a potential head with the peak in early October -- that peak also amounted to a bearish engulfing pattern. |
The bearish engulfing pattern is a bearish reversal signal from the Japanese candlestick methodology. The bearish engulfing pattern is composed of two opposite colored candles, with the second candle enveloping the body of the prior candle. The emergence of this pattern on October 7 signaled that the bulls were losing their influence and forewarned of a potential decline. A closing violation of the neckline in the 3050 region would target a move toward the vicinity of the DJA August lows, with a minimum objective in the 2945 region.  Figure 3: Dow Jones Composite Average These three indexes represent different sectors of the US equity market and are currently developing bearish patterns, which on completion may eliminate the recent divergence with the Dow Jones Industrial Average. |
Chris Manuell spent 7 years as a futures sales/trader for a large investment bank and more recently as a technical analyst for an independent research company. He has a bachelor of economics and graduate diploma in applied finance & investment. Currently enrolled in the CMT program with the MTA.
| E-mail address: | chrismanuell5@yahoo.co.uk |
Click here for more information about our publications!
Comments
Date: 10/28/04Rank: 5Comment:
Date: 11/09/04Rank: 5Comment:

|

Request Information From Our Sponsors
- StockCharts.com, Inc.
- Candle Patterns
- Candlestick Charting Explained
- Intermarket Technical Analysis
- John Murphy on Chart Analysis
- John Murphy's Chart Pattern Recognition
- John Murphy's Market Message
- MurphyExplainsMarketAnalysis-Intermarket Analysis
- MurphyExplainsMarketAnalysis-Visual Analysis
- StockCharts.com
- Technical Analysis of the Financial Markets
- The Visual Investor
- VectorVest, Inc.
- Executive Premier Workshop
- One-Day Options Course
- OptionsPro
- Retirement Income Workshop
- Sure-Fire Trading Systems (VectorVest, Inc.)
- Trading as a Business Workshop
- VectorVest 7 EOD
- VectorVest 7 RealTime/IntraDay
- VectorVest AutoTester
- VectorVest Educational Services
- VectorVest OnLine
- VectorVest Options Analyzer
- VectorVest ProGraphics v6.0
- VectorVest ProTrader 7
- VectorVest RealTime Derby Tool
- VectorVest Simulator
- VectorVest Variator
- VectorVest Watchdog
