HOT TOPICS LIST
- MACD
- Fibonacci
- RSI
- Gann
- ADXR
- Stochastics
- Volume
- Triangles
- Futures
- Cycles
- Volatility
- ZIGZAG
- MESA
- Retracement
- Aroon
INDICATORS LIST
LIST OF TOPICS
PRINT THIS ARTICLE
by Kevin Hopson
FuelCell continues to rally, but the stock is now coming up on an inflection point.
Position: Hold
Kevin Hopson
Kevin has been a technical analyst for roughly 10 years now. Previously, Kevin owned his own business and acted as a registered investment advisor, specializing in energy. He was also a freelance oil analyst for Orient Trading Co., a commodity futures trading firm in Japan. Kevin is currently a freelance writer.
PRINT THIS ARTICLE
TECHNICAL ANALYSIS
FuelCell Energy Still Chugging Along
10/26/04 10:04:26 AMby Kevin Hopson
FuelCell continues to rally, but the stock is now coming up on an inflection point.
Position: Hold
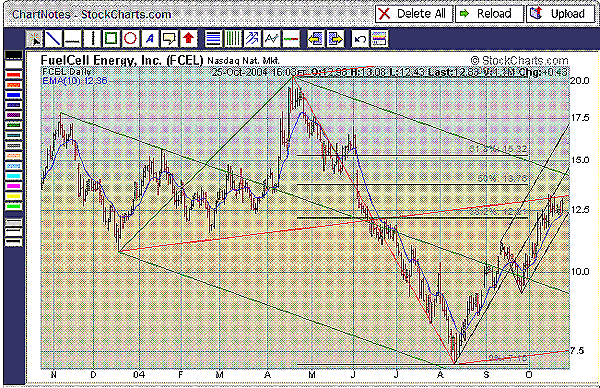
| The last time I touched on FuelCell Energy (FCEL), I said that the stock's bottom reversal could eventually lead to a test of the 38.2% retracement level ($12.21) from the April to August decline. As you can see in the one-year chart, FuelCell tested this retracement level earlier this month and proceeded to break resistance here. However, the stock was recently turned back around the $13.25 level, which is the site of the red and black median lines. Median lines tend to act as significant reversal points, especially when two or more lines converge at the same price level, which was the case with FuelCell. |
| On the other hand, FuelCell has solid short-term support in the $12.00 to $12.40 range. This is the site of FuelCell's 10-day moving average, which has acted as ultimate support during this month's runup. In addition, the bottom parallel line of the black pitchfork comes into play at the lower end of this support range. As a result, the question now is whether support or resistance will win out in the end. Fortunately, there are some factors to help determine which way prices will break. |

|
| One-year chart for FCEL |
| Graphic provided by: Stockcharts.com. |
| |
| For example, note how the bottom black parallel line and the 10-day moving average are both sloping upward. Prices are much more likely to find support when these two indicators are rising. The same thing applies to resistance. More specifically, prices are more likely to find resistance along a downtrend line than an uptrend line. Since the red median line is uptrending, FuelCell should have less difficulty overcoming this resistance level ($13.25). In addition, median line resistance tends to be strongest on the first test. As you can see in the chart, FuelCell has bumped up against the red median several times, meaning that resistance here could be fading. |
| As a result, I would say an upside breakout is more likely at this point in time. If so, the next upside target could be $13.76, which is the site of the 50% retracement level from the April to August decline. Additional upside targets are $14.25-$14.50 (black median line and top green parallel line) and $15.32 (61.8% retracement from the April to August decline). In the meantime, I would continue to hold, as the path of least resistance is still higher. |
Kevin has been a technical analyst for roughly 10 years now. Previously, Kevin owned his own business and acted as a registered investment advisor, specializing in energy. He was also a freelance oil analyst for Orient Trading Co., a commodity futures trading firm in Japan. Kevin is currently a freelance writer.
| Glen Allen, VA | |
| E-mail address: | hopson_1@yahoo.com |
Click here for more information about our publications!
Comments
Date: 10/26/04Rank: 3Comment:
Date: 12/14/04Rank: Comment: Do you think prices will rally back to 11 in the near term?

Request Information From Our Sponsors
- StockCharts.com, Inc.
- Candle Patterns
- Candlestick Charting Explained
- Intermarket Technical Analysis
- John Murphy on Chart Analysis
- John Murphy's Chart Pattern Recognition
- John Murphy's Market Message
- MurphyExplainsMarketAnalysis-Intermarket Analysis
- MurphyExplainsMarketAnalysis-Visual Analysis
- StockCharts.com
- Technical Analysis of the Financial Markets
- The Visual Investor
- VectorVest, Inc.
- Executive Premier Workshop
- One-Day Options Course
- OptionsPro
- Retirement Income Workshop
- Sure-Fire Trading Systems (VectorVest, Inc.)
- Trading as a Business Workshop
- VectorVest 7 EOD
- VectorVest 7 RealTime/IntraDay
- VectorVest AutoTester
- VectorVest Educational Services
- VectorVest OnLine
- VectorVest Options Analyzer
- VectorVest ProGraphics v6.0
- VectorVest ProTrader 7
- VectorVest RealTime Derby Tool
- VectorVest Simulator
- VectorVest Variator
- VectorVest Watchdog
