HOT TOPICS LIST
- MACD
- Fibonacci
- RSI
- Gann
- ADXR
- Stochastics
- Volume
- Triangles
- Futures
- Cycles
- Volatility
- ZIGZAG
- MESA
- Retracement
- Aroon
INDICATORS LIST
LIST OF TOPICS
PRINT THIS ARTICLE
by Chris Manuell
Traders, technicians, and even fundamentalists are all well versed in the theory of round numbers as support and resistance levels. The 10,000 level in the Dow Jones Industrial Average has acted as a magnet this year with prices reticent to stray too far from that level -- this time might be different.Traders, technicians, and even fundamentalists are all well versed in the theory of round numbers as support and resistance levels. The 10,000 level in the Dow Jones Industrial Average has acted as a magnet this year with prices reticent to stray too far from that level -- this time might be different.
Position: N/A
Chris Manuell
Chris Manuell spent 7 years as a futures sales/trader for a large investment bank and more recently as a technical analyst for an independent research company. He has a bachelor of economics and graduate diploma in applied finance & investment. Currently enrolled in the CMT program with the MTA.
PRINT THIS ARTICLE
TECHNICAL ANALYSIS
Dow Donuts Or Donoughts
10/21/04 09:02:05 AMby Chris Manuell
Traders, technicians, and even fundamentalists are all well versed in the theory of round numbers as support and resistance levels. The 10,000 level in the Dow Jones Industrial Average has acted as a magnet this year with prices reticent to stray too far from that level -- this time might be different.Traders, technicians, and even fundamentalists are all well versed in the theory of round numbers as support and resistance levels. The 10,000 level in the Dow Jones Industrial Average has acted as a magnet this year with prices reticent to stray too far from that level -- this time might be different.
Position: N/A
| There is a tendency for round numbers to halt rallies or declines, as the trader's mindset is attuned to thinking of important round numbers. Robert Schiller, in his insightful IRRATIONAL EXUBERANCE, refers to these round-number levels as "quantitative anchors," and they explain the "unusual market behavior surrounding such levels." A quantitative anchor gives market participants a guideline to the value of the market and allows them to determine what position they should initiate. Carol Osler, in an article entitled " Support For Resistance: Technical Analysis And Intraday Exhange Rates," in a rigorous testing of support and resistance levels in the foreign exchange markets, discovered a disproportionate use of round numbers. The high number of market participants watching these levels contributes to the volatility around these points. |
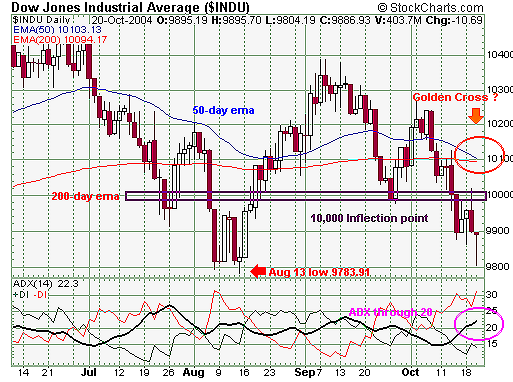
| The Dow Jones Industrial Average (DJIA) has historically demonstrated a penchant for stalling around multiples of 1000. The most infamous example is the 1000 level in the 1960s, which proved an elusive barrier. The DJIA finally pierced the 1000 level in January 1966, but the index could not muster a close above that level until 1972, which also corresponded to a stock market crash that year. The DJIA has oscillated around the 10,000 level since its first foray to that region in March of this year, all while recording lower peaks and lower troughs as the market technically remains in a bear market. The most recent flirting with the 10,000 level on October 19 demonstrated a violent rejection of that level; Gann traders would mark that date with an anniversary from the October 19, 1987, stock market crash. The long upper shadow on the daily candle after making a high of 10,020 signifies a reluctance to move higher and was a friendly reminder to bulls of what lies ahead. Interestingly, the following session sparked another rejection albeit on the downside. The long lower shadow on the candle completed a hammer formation, demonstrating aggressive demand around the 9800 region and a show of respect to the August trough at 9783.91. |

|
| Figure 1: DJIA Daily |
| Graphic provided by: StockCharts.com. |
| |
| A technique used by candlestick followers to help interpret the market is referred to as "blending," which involves merging the previous two candles. This can be achieved by taking the first candle's open and the last candle's close and the highest high and the lowest low of the two candles to construct a new candle. A blending of the DJIA candles from October 19 and 20 would present a candle with both long upper and lower shadows. This represents a period of indecision with the market at a potential turning point. |
| A study of the daily DJIA chart also reveals that we are at an important juncture, with the market hovering above the key support level from the August 13th trough at 9783.91. A push back above the key 10,000 level would validate the bullish hammer from October 20 and allow a temporary reprieve from the important August trough, which needs to be violated on a closing basis to keep the bear market alive. Bears would be monitoring the movement of a couple of important exponential averages -- the 50-day and 200-day exponential moving average (EMA) They are poised to complete a bearish crossover, which involves the faster moving average, the 50-day EMA crossing over the slower moving average, which is the 200-day EMA. This dual moving average crossover also has the potential to register as a "golden cross." The golden cross emanates from Japanese trading methods and is a moving average crossover in which both the short-term and the long-term moving averages are traveling in the same direction. |
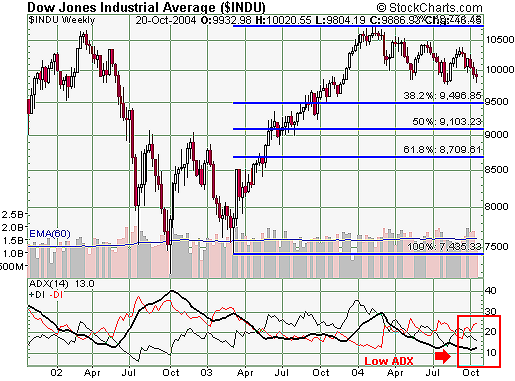
| The short-term consensus and the long-term consensus are both in harmony, heightening the probability of a trend to remain in motion. A move by the DJIA's downward sloping 50-day EMA through the downward pointing 200-day EMA would signal a golden cross and point to a continuation of the bear market. The most recent bearish 50-day EMA and 200-day EMA crossover in the DJIA occurred in June 2002, which coincidentally was in the vicinity of the 10,000 level, and triggered a powerful move lower. The daily average directional movement index (ADX) has recently pushed off a low base and through the pivotal 20 region that often marks the commencement of a strong trend. The uptick in the daily ADX also corresponds to a low level in the weekly ADX, recently recording its lowest level in over three years. Indicators that are moving together in different time periods provide a greater confidence level for the trader. The daily and weekly ADX on the DJIA suggest the potential for a major move in the immediate future. A close beneath the DJIA's yearly low from August 13 at 9783.91 in the near term would increase the likelihood of the golden cross been completed and also support the rising ADX. Medium-term targets could be provided by Fibonacci retracements of the 2003 rally, demonstrated on the weekly chart with a 0.382 target of 9,496.85 and the 0.500 retracement at 9,103.23.  |
Chris Manuell spent 7 years as a futures sales/trader for a large investment bank and more recently as a technical analyst for an independent research company. He has a bachelor of economics and graduate diploma in applied finance & investment. Currently enrolled in the CMT program with the MTA.
| E-mail address: | chrismanuell5@yahoo.co.uk |
Click here for more information about our publications!
Comments
Date: 11/01/04Rank: 5Comment:
Date: 11/09/04Rank: 5Comment:

Request Information From Our Sponsors
- StockCharts.com, Inc.
- Candle Patterns
- Candlestick Charting Explained
- Intermarket Technical Analysis
- John Murphy on Chart Analysis
- John Murphy's Chart Pattern Recognition
- John Murphy's Market Message
- MurphyExplainsMarketAnalysis-Intermarket Analysis
- MurphyExplainsMarketAnalysis-Visual Analysis
- StockCharts.com
- Technical Analysis of the Financial Markets
- The Visual Investor
- VectorVest, Inc.
- Executive Premier Workshop
- One-Day Options Course
- OptionsPro
- Retirement Income Workshop
- Sure-Fire Trading Systems (VectorVest, Inc.)
- Trading as a Business Workshop
- VectorVest 7 EOD
- VectorVest 7 RealTime/IntraDay
- VectorVest AutoTester
- VectorVest Educational Services
- VectorVest OnLine
- VectorVest Options Analyzer
- VectorVest ProGraphics v6.0
- VectorVest ProTrader 7
- VectorVest RealTime Derby Tool
- VectorVest Simulator
- VectorVest Variator
- VectorVest Watchdog
