HOT TOPICS LIST
- MACD
- Fibonacci
- RSI
- Gann
- ADXR
- Stochastics
- Volume
- Triangles
- Futures
- Cycles
- Volatility
- ZIGZAG
- MESA
- Retracement
- Aroon
INDICATORS LIST
LIST OF TOPICS
PRINT THIS ARTICLE
by Han Kim
If you are a visual thinker like myself, you might find candlestick charts more informative than the standard bar charts. By turning the open, high, low, and close (OHLC) data of the traditional bar chart into candlesticks, daily price changes, and chart patterns become visible at a glance.
Position: N/A
Han Kim
Traders.com Advantage Staff Writer
PRINT THIS ARTICLE
CANDLESTICK CHARTING
Far East Flavor Part 1 - The Hammer
05/30/00 04:43:47 PMby Han Kim
If you are a visual thinker like myself, you might find candlestick charts more informative than the standard bar charts. By turning the open, high, low, and close (OHLC) data of the traditional bar chart into candlesticks, daily price changes, and chart patterns become visible at a glance.
Position: N/A
| A candlestick contains four primary pieces of information: the open, high, low, and closing prices. The body of the candlestick consists of a rectangle formed between the opening and closing prices. When the closing price is lower than the opening price, the candlestick's body is filled in, usually in black or red, and when the security closes higher, the body is white or green (you can choose any color scheme). Much like a bar in a bar chart, the wicks (the thin line above and/or below the body) show the range of the price movements for that day. Using this data, a visual interpretation of the day's activity can be summarized. |
I like to divide the candlestick in two parts: the actual change, and the day's range. I view these in terms of apparent and hidden indicators. The apparent change, the actual difference in the open and the close, makes up the body of the candlestick. The hidden change is the shadow. When you look at a candlestick chart you should notice four factors right away: 1) The different colors of the body. This is a fast visual signal for positive or negative price change. By utilizing these visual concepts of a given day's data and the overall pattern of the chart, you can be alerted to clues of a security's next move. Candlestick charting is not limited to daily data and can be used for intraday or longer time frames. |

|
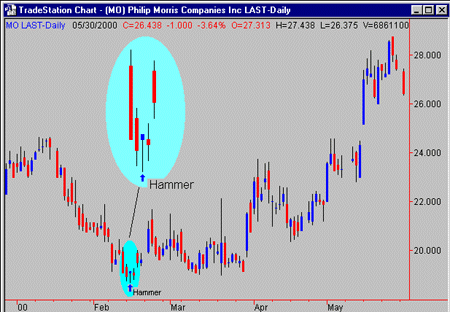
| Candlestick chart of Philip Morris Companies Inc. (MO) with enlarged view of the area of interest. |
| Graphic provided by: TradeStation. |
| |
| In this first candlestick chart analysis, I will take a look at the "hammer". The characteristics of a hammer are a long bottom shadow (at least twice the length of the body), with the body at or very near the top of the range. It is a hammer only if it occurs during a downtrend, and it indicates the possibility of a reversal. In the chart of Phillip Morris Companies Inc. (MO), a hammer formed in mid-February, just before a rise in prices. In theory, a hammer occurs when the price tests the bottom of the price range. Buyers decide that the price isn't going any lower, and the price then climbs upward, closing at or very near the top of the day's price range. |
Traders.com Advantage Staff Writer
| Title: | Webmaster |
| Company: | Technical Analysis, Inc. |
| Address: | 4757 California AVE SW |
| Seattle, WA 98116 | |
| Phone # for sales: | 206-938-0570 |
| Fax: | 206-938-1307 |
| Website: | www.traders.com |
| E-mail address: | hkim@traders.com |
Traders' Resource Links | |
| Charting the Stock Market: The Wyckoff Method -- Books | |
| Working-Money.com -- Online Trading Services | |
| Traders.com Advantage -- Online Trading Services | |
| Technical Analysis of Stocks & Commodities -- Publications and Newsletters | |
| Working Money, at Working-Money.com -- Publications and Newsletters | |
| Traders.com Advantage -- Publications and Newsletters | |
| Professional Traders Starter Kit -- Software | |
Click here for more information about our publications!
Comments
Date: / /Rank: 4Comment:
Date: / /Rank: 5Comment:
Date: / /Rank: 3Comment:

Request Information From Our Sponsors
- VectorVest, Inc.
- Executive Premier Workshop
- One-Day Options Course
- OptionsPro
- Retirement Income Workshop
- Sure-Fire Trading Systems (VectorVest, Inc.)
- Trading as a Business Workshop
- VectorVest 7 EOD
- VectorVest 7 RealTime/IntraDay
- VectorVest AutoTester
- VectorVest Educational Services
- VectorVest OnLine
- VectorVest Options Analyzer
- VectorVest ProGraphics v6.0
- VectorVest ProTrader 7
- VectorVest RealTime Derby Tool
- VectorVest Simulator
- VectorVest Variator
- VectorVest Watchdog
- StockCharts.com, Inc.
- Candle Patterns
- Candlestick Charting Explained
- Intermarket Technical Analysis
- John Murphy on Chart Analysis
- John Murphy's Chart Pattern Recognition
- John Murphy's Market Message
- MurphyExplainsMarketAnalysis-Intermarket Analysis
- MurphyExplainsMarketAnalysis-Visual Analysis
- StockCharts.com
- Technical Analysis of the Financial Markets
- The Visual Investor
