HOT TOPICS LIST
- MACD
- Fibonacci
- RSI
- Gann
- ADXR
- Stochastics
- Volume
- Triangles
- Futures
- Cycles
- Volatility
- ZIGZAG
- MESA
- Retracement
- Aroon
INDICATORS LIST
LIST OF TOPICS
PRINT THIS ARTICLE
by Arthur Hill
The Auto Parts and Auto Manufacturing indexes are breaking down, and this entails an outsized move for the Auto Parts group.
Position: Sell
Arthur Hill
Arthur Hill is currently editor of TDTrader.com, a website specializing in trading strategies, sector/industry specific breadth stats and overall technical analysis. He passed the Society of Technical Analysts (STA London) diploma exam with distinction is a Certified Financial Technician (CFTe). Prior to TD Trader, he was the Chief Technical Analyst for Stockcharts.com and the main contributor to the ChartSchool.
PRINT THIS ARTICLE
CHART ANALYSIS
Autos Buckle Up For A Fall
10/21/04 08:19:57 AMby Arthur Hill
The Auto Parts and Auto Manufacturing indexes are breaking down, and this entails an outsized move for the Auto Parts group.
Position: Sell
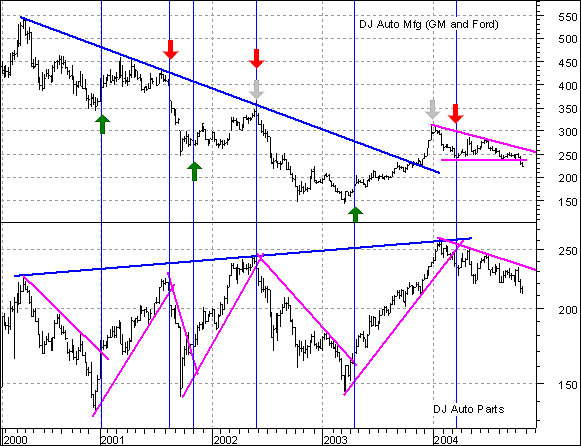
| Despite a sizable advance in 2003, the DJ US Auto Manufacturing Index (DJUSAU) has been trending lower since April 2000. Even though the index broke above the blue trendline, the January 2004 high is lower than the May 2002 high and the index recently broke the lower support line of a descending triangle (magenta trendlines). |
| In contrast, the DJ US Auto Parts Index (DJUSAP) has traded within a large range since March 2000. As the magenta trendlines show, there have been seven swings over this period and the current swing is down. The blue vertical lines correspond to the swing reversals or trendline breaks in the index. Note that these roughly correspond to advancing and declining periods in the Auto Manufacturing Index. |

|
| Figure 1: Dow Jones Auto Manufacturing vs. Dow Jones Auto Parts |
| Graphic provided by: MetaStock. |
| Graphic provided by: Reuters Data. |
| |
| Even though these swings correspond, it is clear that the swings are much more pronounced in the Auto Parts Index, both up and down. When the Auto Manufacturing Index turned up, the Auto Parts Index moved above 220, 240, and 250. When the Auto Manufacturing Index turned down, the Auto Parts Index moved below 150 each time. |
| The relationship between these two groups is not hard to imagine. When business is good for Auto Manufacturing, the demand for parts increases. When business is bad for Auto Manufacturing, the demand for parts decreases. With the recent descending triangle support break, the Auto Manufacturing Index looks headed lower, and this would suggest another move toward support around 150 for the Auto Parts Index. So buckle up. |
Arthur Hill is currently editor of TDTrader.com, a website specializing in trading strategies, sector/industry specific breadth stats and overall technical analysis. He passed the Society of Technical Analysts (STA London) diploma exam with distinction is a Certified Financial Technician (CFTe). Prior to TD Trader, he was the Chief Technical Analyst for Stockcharts.com and the main contributor to the ChartSchool.
| Title: | Editor |
| Company: | TDTrader.com |
| Address: | Willem Geetsstraat 17 |
| Mechelen, B2800 | |
| Phone # for sales: | 3215345465 |
| Website: | www.tdtrader.com |
| E-mail address: | arthurh@tdtrader.com |
Traders' Resource Links | |
| TDTrader.com has not added any product or service information to TRADERS' RESOURCE. | |
Click here for more information about our publications!
Comments

Request Information From Our Sponsors
- StockCharts.com, Inc.
- Candle Patterns
- Candlestick Charting Explained
- Intermarket Technical Analysis
- John Murphy on Chart Analysis
- John Murphy's Chart Pattern Recognition
- John Murphy's Market Message
- MurphyExplainsMarketAnalysis-Intermarket Analysis
- MurphyExplainsMarketAnalysis-Visual Analysis
- StockCharts.com
- Technical Analysis of the Financial Markets
- The Visual Investor
- VectorVest, Inc.
- Executive Premier Workshop
- One-Day Options Course
- OptionsPro
- Retirement Income Workshop
- Sure-Fire Trading Systems (VectorVest, Inc.)
- Trading as a Business Workshop
- VectorVest 7 EOD
- VectorVest 7 RealTime/IntraDay
- VectorVest AutoTester
- VectorVest Educational Services
- VectorVest OnLine
- VectorVest Options Analyzer
- VectorVest ProGraphics v6.0
- VectorVest ProTrader 7
- VectorVest RealTime Derby Tool
- VectorVest Simulator
- VectorVest Variator
- VectorVest Watchdog
