HOT TOPICS LIST
- MACD
- Fibonacci
- RSI
- Gann
- ADXR
- Stochastics
- Volume
- Triangles
- Futures
- Cycles
- Volatility
- ZIGZAG
- MESA
- Retracement
- Aroon
INDICATORS LIST
LIST OF TOPICS
PRINT THIS ARTICLE
by Arthur Hill
After a sharp reversal in August, the Broad Band HOLDRS (BDH) recovered with an equally sharp advance to lead the Nasdaq in October.
Position: Buy
Arthur Hill
Arthur Hill is currently editor of TDTrader.com, a website specializing in trading strategies, sector/industry specific breadth stats and overall technical analysis. He passed the Society of Technical Analysts (STA London) diploma exam with distinction is a Certified Financial Technician (CFTe). Prior to TD Trader, he was the Chief Technical Analyst for Stockcharts.com and the main contributor to the ChartSchool.
PRINT THIS ARTICLE
TECHNICAL INDICATORS
Breakout For Broad Band
10/21/04 09:16:37 AMby Arthur Hill
After a sharp reversal in August, the Broad Band HOLDRS (BDH) recovered with an equally sharp advance to lead the Nasdaq in October.
Position: Buy
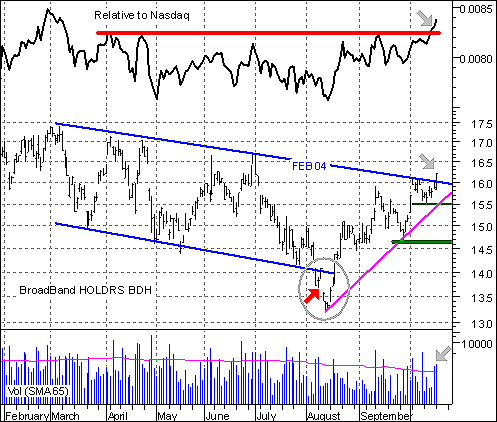
| After a sharp reversal in August, the Broad Band HOLDRS (BDH) recovered with an equally sharp advance. Currently, it is leading the Nasdaq and shows good relative strength. The top indicator is the price relative (BDH divided by COMPQ), and this compares the performance of BDH against the Nasdaq. Note that the price relative broke resistance and recorded a six-month high this month. BDH is clearly outperforming the Nasdaq, and this bodes well for future performance. |
| As the daily chart shows, BDH has been in a downtrend throughout 2004 with a series of lower lows and lower highs. The most recent low in August formed with an exhaustion gap (red arrow). The gap is considered an exhaustion gap because it failed to hold and was filled with a sudden reversal. In addition, the free fall in the first half of August was a capitulation of sorts. See Figure 1. |

|
| Figure 1: Daily chart |
| Graphic provided by: MetaStock. |
| |
| The current advance carried the index back to the trendline extending down from February. There was a small consolidation and then a trendline breakout on above-average volume (gray arrows). This trendline break is quite positive and calls for further strength. |
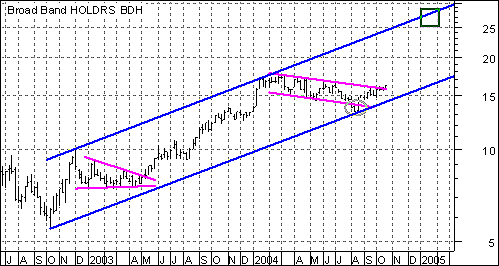
The true significance of this trendline break can be seen on the weekly chart, where this decline looks like a falling flag or price channel (magenta lines) (Figure 2). These are typically corrective patterns and the trendline break signals a continuation of the prior advance (April 2003 to January 2004). With the August reaction low, it is possible to draw a rising price channel and the recent breakout opens the door to a test of the upper trendline (green box). This forecast a move to the mid-20s by early 2005. Watch support levels at 15.5 and 14.5 for signs of failure.  Figure 2: Weekly chart |
Arthur Hill is currently editor of TDTrader.com, a website specializing in trading strategies, sector/industry specific breadth stats and overall technical analysis. He passed the Society of Technical Analysts (STA London) diploma exam with distinction is a Certified Financial Technician (CFTe). Prior to TD Trader, he was the Chief Technical Analyst for Stockcharts.com and the main contributor to the ChartSchool.
| Title: | Editor |
| Company: | TDTrader.com |
| Address: | Willem Geetsstraat 17 |
| Mechelen, B2800 | |
| Phone # for sales: | 3215345465 |
| Website: | www.tdtrader.com |
| E-mail address: | arthurh@tdtrader.com |
Traders' Resource Links | |
| TDTrader.com has not added any product or service information to TRADERS' RESOURCE. | |
Click here for more information about our publications!
Comments
Date: 10/21/04Rank: 5Comment:
Date: 10/23/04Rank: 3Comment:
Date: 10/30/04Rank: 5Comment: Where do you see the NASDAQ in the next 120 days? Would you be buying calls at this point? The Mar 05 1850 calls are cheep right now but could easily rise in value considering the current chart formation. I Like what I see so far. Thank You, James Sheley E:Mail sterlingappraisal@coiinc.com

|

Request Information From Our Sponsors
- StockCharts.com, Inc.
- Candle Patterns
- Candlestick Charting Explained
- Intermarket Technical Analysis
- John Murphy on Chart Analysis
- John Murphy's Chart Pattern Recognition
- John Murphy's Market Message
- MurphyExplainsMarketAnalysis-Intermarket Analysis
- MurphyExplainsMarketAnalysis-Visual Analysis
- StockCharts.com
- Technical Analysis of the Financial Markets
- The Visual Investor
- VectorVest, Inc.
- Executive Premier Workshop
- One-Day Options Course
- OptionsPro
- Retirement Income Workshop
- Sure-Fire Trading Systems (VectorVest, Inc.)
- Trading as a Business Workshop
- VectorVest 7 EOD
- VectorVest 7 RealTime/IntraDay
- VectorVest AutoTester
- VectorVest Educational Services
- VectorVest OnLine
- VectorVest Options Analyzer
- VectorVest ProGraphics v6.0
- VectorVest ProTrader 7
- VectorVest RealTime Derby Tool
- VectorVest Simulator
- VectorVest Variator
- VectorVest Watchdog
