HOT TOPICS LIST
- MACD
- Fibonacci
- RSI
- Gann
- ADXR
- Stochastics
- Volume
- Triangles
- Futures
- Cycles
- Volatility
- ZIGZAG
- MESA
- Retracement
- Aroon
INDICATORS LIST
LIST OF TOPICS
PRINT THIS ARTICLE
by Koos van der Merwe
Trade what you see, not what you think you see.
Position: N/A
Koos van der Merwe
Has been a technical analyst since 1969, and has worked as a futures and options trader with First Financial Futures in Johannesburg, South Africa.
PRINT THIS ARTICLE
ELLIOTT WAVE
Trade What You See
10/20/04 10:10:21 AMby Koos van der Merwe
Trade what you see, not what you think you see.
Position: N/A
| "Trade what you see, not what you think you see." These wise words are pasted on top of my computer as a reminder to keep emotion out of my trading. They were given to me in 1972 by a very successful trader who, in those days, traded the market without a computer, drawing all his charts by hand. He was an Elliottician -- that is, a firm believer in the Elliott wave theory -- and his charts were rolled up and consulted like the Torah, the scrolls of Judaism, and handled with the same respect. He is no longer alive, and my deepest regret is not having kept one of those scrolls as a reminder of an astute teacher. |
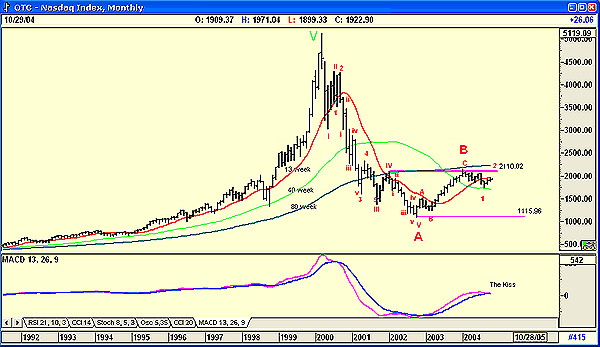
| Figure 1 is of the Nasdaq, and one of the reasons for the quote above. One reads about cycles, which state that the months from November to April are the best trading months of the year. Then there is the Presidential cycle, possibly even more important, which states that the first two years after an election are usually negative years, which in the past have been prone to wars, recessions, and major bear markets. When an incumbent wins, November is a negative month, and when an incumbent loses, November is usually a strong month. Nothing however, is cast in stone, but the niggling is there, and you are reminded, "Trade what you see..." ...And what I see is scary. |

|
| Figure 1: The Nasdaq and its preferred wave count |
| Graphic provided by: AdvancedGET. |
| |
| The Nasdaq is below the 80-week moving average (80 x 5 trading days = 400 days) The Nasdaq is below the 13-week moving average (13 x 5 trading days = 65 days) The Nasdaq is above the 40-week moving average (40 x 5 trading days = 200 days) Why are these moving averages important? They are not. The only one that is the 40-week moving average (200 day), which has become a stalwart, emotionally tests market direction. |
| Then there is the Elliott wave count, which looks very true, and suggests that a wave 2 of wave C could be in progress. The upper resistance level is 2110, and a decisive break above this level will negate the wave count. However, a break below the 40-week moving average will strengthen the possibility of a C-wave down move, and a break below 1115 will confirm it. |
| The more immediate concern, however, is the moving average convergence/divergence (MACD) indicator, which at the moment is kissing the trigger line but has not penetrated it. A break below it will be the kiss of death, the final nail in the coffin. What I believe I see is not what I wanted to see, and until a definite trend is confirmed, I will trade what I see, which at the moment is still a bullish market. Finally, remember that since 1885, there has never been a losing fifth year, although there have been a number that have been flat. The year 2005 is a post-election year coming off a bubble, so who knows what will happen. Only your charts know, so remember, and remind yourself constantly, trade what you see. |
Has been a technical analyst since 1969, and has worked as a futures and options trader with First Financial Futures in Johannesburg, South Africa.
| Address: | 3256 West 24th Ave |
| Vancouver, BC | |
| Phone # for sales: | 6042634214 |
| E-mail address: | petroosp@gmail.com |
Click here for more information about our publications!
Comments
Date: 10/20/04Rank: 5Comment:
Date: 10/23/04Rank: 3Comment:
Date: 10/26/04Rank: 5Comment:
Date: 10/26/04Rank: 4Comment:

Request Information From Our Sponsors
- VectorVest, Inc.
- Executive Premier Workshop
- One-Day Options Course
- OptionsPro
- Retirement Income Workshop
- Sure-Fire Trading Systems (VectorVest, Inc.)
- Trading as a Business Workshop
- VectorVest 7 EOD
- VectorVest 7 RealTime/IntraDay
- VectorVest AutoTester
- VectorVest Educational Services
- VectorVest OnLine
- VectorVest Options Analyzer
- VectorVest ProGraphics v6.0
- VectorVest ProTrader 7
- VectorVest RealTime Derby Tool
- VectorVest Simulator
- VectorVest Variator
- VectorVest Watchdog
- StockCharts.com, Inc.
- Candle Patterns
- Candlestick Charting Explained
- Intermarket Technical Analysis
- John Murphy on Chart Analysis
- John Murphy's Chart Pattern Recognition
- John Murphy's Market Message
- MurphyExplainsMarketAnalysis-Intermarket Analysis
- MurphyExplainsMarketAnalysis-Visual Analysis
- StockCharts.com
- Technical Analysis of the Financial Markets
- The Visual Investor
