HOT TOPICS LIST
- MACD
- Fibonacci
- RSI
- Gann
- ADXR
- Stochastics
- Volume
- Triangles
- Futures
- Cycles
- Volatility
- ZIGZAG
- MESA
- Retracement
- Aroon
INDICATORS LIST
LIST OF TOPICS
PRINT THIS ARTICLE
by Kevin Hopson
Despite the stock's short-term downtrend, Akita Drilling looks poised to move higher.
Position: Accumulate
Kevin Hopson
Kevin has been a technical analyst for roughly 10 years now. Previously, Kevin owned his own business and acted as a registered investment advisor, specializing in energy. He was also a freelance oil analyst for Orient Trading Co., a commodity futures trading firm in Japan. Kevin is currently a freelance writer.
PRINT THIS ARTICLE
TECHNICAL ANALYSIS
Akita Drilling Showing Strength
10/19/04 09:50:43 AMby Kevin Hopson
Despite the stock's short-term downtrend, Akita Drilling looks poised to move higher.
Position: Accumulate
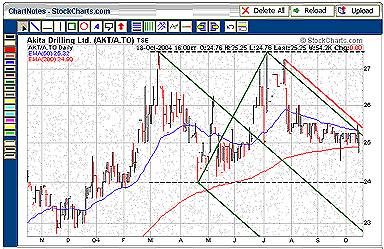
| Akita Drilling (AKT/A), which trades on the Toronto Stock Exchange and US pink sheets, is engaged in the oil and gas contract drilling business. Technically speaking, Akita has been in a steady decline since July, as the stock has continued to find resistance along its falling 50-day moving average ($25.32). However, the stock has been bouncing off its rising 200-day moving average ($24.90) in recent weeks and is showing signs of strength based on pitchfork analysis. |
| For example, note how Akita is bumping up against the top parallel line of the green pitchfork. This downtrend line is currently acting as resistance, along with the 50-day moving average. Also providing resistance is the red parallel (or warning) line. This trendline was drawn from the late July high. As you can see, prices recently reversed here. Given the significant amount of overhead in this area ($25.20-$25.40), one would think that the path of least resistance is lower. However, it is likely just a matter of time before Akita breaks this short-term downtrend. |

|
| Figure 1: Akita |
| Graphic provided by: StockCharts.com. |
| |
| I say this because Akita failed to test the green median line prior to testing top parallel line. In pitchfork analysis, this is known as the "price failure" rule, which indicates price strength in this case. When this occurs, you normally see a break of the top parallel line and warning line (assuming there is one). In addition, Akita has been stuck in a potentially bullish trading range ($24.00-$27.50) since March. Since trading ranges tend to be continuation patterns and the long-term trend is positive, an upside breakout is likely. As a result, I would consider further price weakness as a good buying opportunity. |
Kevin has been a technical analyst for roughly 10 years now. Previously, Kevin owned his own business and acted as a registered investment advisor, specializing in energy. He was also a freelance oil analyst for Orient Trading Co., a commodity futures trading firm in Japan. Kevin is currently a freelance writer.
| Glen Allen, VA | |
| E-mail address: | hopson_1@yahoo.com |
Click here for more information about our publications!
Comments
Date: 10/23/04Rank: 3Comment:

Request Information From Our Sponsors
- StockCharts.com, Inc.
- Candle Patterns
- Candlestick Charting Explained
- Intermarket Technical Analysis
- John Murphy on Chart Analysis
- John Murphy's Chart Pattern Recognition
- John Murphy's Market Message
- MurphyExplainsMarketAnalysis-Intermarket Analysis
- MurphyExplainsMarketAnalysis-Visual Analysis
- StockCharts.com
- Technical Analysis of the Financial Markets
- The Visual Investor
- VectorVest, Inc.
- Executive Premier Workshop
- One-Day Options Course
- OptionsPro
- Retirement Income Workshop
- Sure-Fire Trading Systems (VectorVest, Inc.)
- Trading as a Business Workshop
- VectorVest 7 EOD
- VectorVest 7 RealTime/IntraDay
- VectorVest AutoTester
- VectorVest Educational Services
- VectorVest OnLine
- VectorVest Options Analyzer
- VectorVest ProGraphics v6.0
- VectorVest ProTrader 7
- VectorVest RealTime Derby Tool
- VectorVest Simulator
- VectorVest Variator
- VectorVest Watchdog
