HOT TOPICS LIST
- MACD
- Fibonacci
- RSI
- Gann
- ADXR
- Stochastics
- Volume
- Triangles
- Futures
- Cycles
- Volatility
- ZIGZAG
- MESA
- Retracement
- Aroon
INDICATORS LIST
LIST OF TOPICS
PRINT THIS ARTICLE
by Kevin Hopson
A bearish consolidation pattern and negative divergences on the daily chart could point to lower prices for Internet stocks.
Position: N/A
Kevin Hopson
Kevin has been a technical analyst for roughly 10 years now. Previously, Kevin owned his own business and acted as a registered investment advisor, specializing in energy. He was also a freelance oil analyst for Orient Trading Co., a commodity futures trading firm in Japan. Kevin is currently a freelance writer.
PRINT THIS ARTICLE
WEDGE FORMATIONS
Are Internet Stocks Ready To Break Down?
10/18/04 08:18:15 AMby Kevin Hopson
A bearish consolidation pattern and negative divergences on the daily chart could point to lower prices for Internet stocks.
Position: N/A
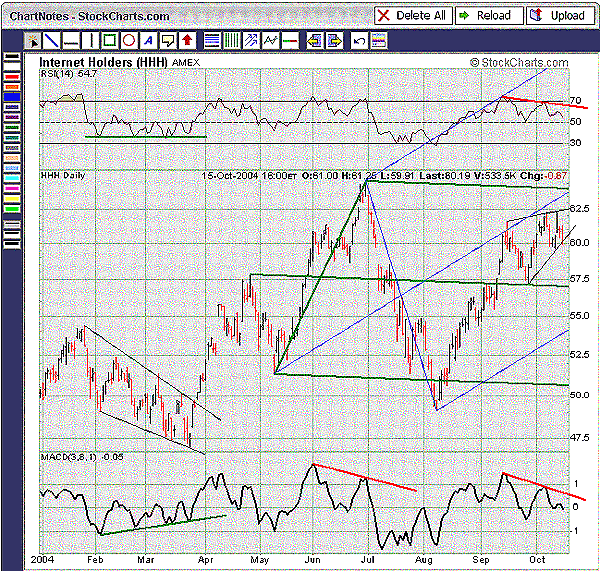
| The Internet Holders (HHH), an exchange-traded fund for Internet stocks, has shown several divergence patterns this year, as illustrated in the year-to-date chart. For example, if you go back to the beginning of this year, you will see that Internet stocks formed a falling wedge during February and March. Because prices tend to break in the opposite direction of the wedge, falling wedges are normally bullish. In the meantime, the relative strength index (RSI) was flattening out, while the moving average convergence/divergence (MACD) was putting in higher lows. These bullish divergences signaled a forthcoming bottom reversal in internet stocks. As you can see, the fund broke out of the falling wedge formation and rallied significantly in April. |
| However, note how the opposite situation occurred in June. More specifically, prices were putting in higher highs, but the MACD failed to confirm this; it was putting in a pattern of lower highs. This bearish divergence signaled a forthcoming top reversal in the fund. As you can see, this scenario played out in July, as Internet stocks proceeded to sell off. |

|
| Figure 1: Year-to-date chart for Internet Holders |
| Graphic provided by: StockCharts.com. |
| |
| That brings us to today. Unfortunately for longs, the outlook is not good. I say this because the fund appears to be forming a rising wedge. As I stated before, prices tend to break in the opposite direction of the wedge. As a result, rising wedges are normally bearish. In addition, note how the RSI and MACD are putting in lower highs despite the fact that prices are moving higher. These bearish divergences could signal a developing top. As a result, I would be cautious in the near term. Even though a break of the bottom trendline (September's uptrend line) is needed to confirm a reversal, more conservative investors might consider selling into strength. |
Kevin has been a technical analyst for roughly 10 years now. Previously, Kevin owned his own business and acted as a registered investment advisor, specializing in energy. He was also a freelance oil analyst for Orient Trading Co., a commodity futures trading firm in Japan. Kevin is currently a freelance writer.
| Glen Allen, VA | |
| E-mail address: | hopson_1@yahoo.com |
Click here for more information about our publications!
Comments
Date: 10/23/04Rank: 3Comment:
Date: 11/04/04Rank: 3Comment:

|

Request Information From Our Sponsors
- StockCharts.com, Inc.
- Candle Patterns
- Candlestick Charting Explained
- Intermarket Technical Analysis
- John Murphy on Chart Analysis
- John Murphy's Chart Pattern Recognition
- John Murphy's Market Message
- MurphyExplainsMarketAnalysis-Intermarket Analysis
- MurphyExplainsMarketAnalysis-Visual Analysis
- StockCharts.com
- Technical Analysis of the Financial Markets
- The Visual Investor
- VectorVest, Inc.
- Executive Premier Workshop
- One-Day Options Course
- OptionsPro
- Retirement Income Workshop
- Sure-Fire Trading Systems (VectorVest, Inc.)
- Trading as a Business Workshop
- VectorVest 7 EOD
- VectorVest 7 RealTime/IntraDay
- VectorVest AutoTester
- VectorVest Educational Services
- VectorVest OnLine
- VectorVest Options Analyzer
- VectorVest ProGraphics v6.0
- VectorVest ProTrader 7
- VectorVest RealTime Derby Tool
- VectorVest Simulator
- VectorVest Variator
- VectorVest Watchdog
