HOT TOPICS LIST
- MACD
- Fibonacci
- RSI
- Gann
- ADXR
- Stochastics
- Volume
- Triangles
- Futures
- Cycles
- Volatility
- ZIGZAG
- MESA
- Retracement
- Aroon
INDICATORS LIST
LIST OF TOPICS
PRINT THIS ARTICLE
by Koos van der Merwe
Last week, I wrote how I could have traded Nortel using point and figure charts. Here's a way to trade Nortel using two moving averages on a point and figure chart.
Position: N/A
Koos van der Merwe
Has been a technical analyst since 1969, and has worked as a futures and options trader with First Financial Futures in Johannesburg, South Africa.
PRINT THIS ARTICLE
POINT & FIGURE
Point & Figure And Moving Averages
10/18/04 11:13:50 AMby Koos van der Merwe
Last week, I wrote how I could have traded Nortel using point and figure charts. Here's a way to trade Nortel using two moving averages on a point and figure chart.
Position: N/A
| In last week's article, I mentioned that one of the problems found with classical point and figure charting is that a trader would trade the share late -- that is, after the price has started moving. This was beneficial because the trader has the advantage of always trading in the direction of the trend. Although I am a traditionalist, I must admit that computers today have given us an advantage. We are able to chart many variations in point and figure parameters, and look for more profitable trading strategies. |
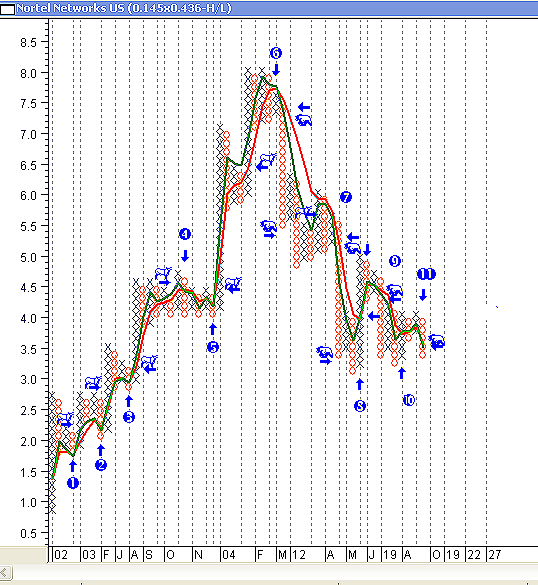
| The point and figure chart of Nortel, as shown in Figure 1, is not the same as the one printed last week. Instead of a chart of the close, with a parameter of 0.1 and a three-point reversal, I have drawn a P&F chart using the range of the range of the high and the low. The parameter is computer-calculated at 0.1452 with a three-point reversal. I have also drawn a five-period exponential moving average (green) and a 15-period moving average (red) on the chart. The intention is to forewarn us of a future P&F breakout, either up and down. |

|
| Figure 1: Nortel and P&F plus moving averages. The point and figure chart of Nortel, as shown here, is not the same as the one printed last week. |
| Graphic provided by: MetaStock. |
| |
| In analyzing the chart: 1, 2, and 3. Note how the crossover of the two moving averages have given a buy signal long before the P&F chart gave a buy signal. I have highlighted a P&F buy signal with a "bull," and a P&F sell signal with a "bear." 4. Here, the moving average gave a sell signal after the P&F chart gave a buy signal. The price did move down, but the moving average crossover gave a buy long before the P&F gave a buy signal. 5. The moving average gave a buy signal well ahead of the P&F buy, as shown by the bull. 6. The moving average would have taken you out well before the P&F sell signal, as shown by the bear on the chart. The P&F buy signal was not confirmed by the moving averages, so we would have remained short. 8. This was a buy, and 9. This was a sell. 10. and 11. Consolidation occurred, with the moving average at first suggesting a buy at "10," which changed to a sell signal at "11," as the price fell away in a P&F sell signal, as shown by the bear. |
| At the moment, the P&F is suggesting a consolidation phase that may culminate in a triple-top buy signal. The moving averages, however, are suggesting a sell signal. Any move of the short-term moving average (green) above the long-term moving average (red) would confirm that a triple-top breakout upward is imminent. Should this occur, using the horizontal target count as explained in my article last week, Nortel should rise to $7.16. (7 columns x 3 point reversal = 21 x 0.1452 (parameter) = 3.05 + 4.11 = 7.16) |
| Here is another arrow in your decision-making quiver. |
Has been a technical analyst since 1969, and has worked as a futures and options trader with First Financial Futures in Johannesburg, South Africa.
| Address: | 3256 West 24th Ave |
| Vancouver, BC | |
| Phone # for sales: | 6042634214 |
| E-mail address: | petroosp@gmail.com |
Click here for more information about our publications!
Comments
Date: 10/23/04Rank: 2Comment:
Date: 04/29/08Rank: 5Comment:

|

Request Information From Our Sponsors
- VectorVest, Inc.
- Executive Premier Workshop
- One-Day Options Course
- OptionsPro
- Retirement Income Workshop
- Sure-Fire Trading Systems (VectorVest, Inc.)
- Trading as a Business Workshop
- VectorVest 7 EOD
- VectorVest 7 RealTime/IntraDay
- VectorVest AutoTester
- VectorVest Educational Services
- VectorVest OnLine
- VectorVest Options Analyzer
- VectorVest ProGraphics v6.0
- VectorVest ProTrader 7
- VectorVest RealTime Derby Tool
- VectorVest Simulator
- VectorVest Variator
- VectorVest Watchdog
- StockCharts.com, Inc.
- Candle Patterns
- Candlestick Charting Explained
- Intermarket Technical Analysis
- John Murphy on Chart Analysis
- John Murphy's Chart Pattern Recognition
- John Murphy's Market Message
- MurphyExplainsMarketAnalysis-Intermarket Analysis
- MurphyExplainsMarketAnalysis-Visual Analysis
- StockCharts.com
- Technical Analysis of the Financial Markets
- The Visual Investor
