HOT TOPICS LIST
- MACD
- Fibonacci
- RSI
- Gann
- ADXR
- Stochastics
- Volume
- Triangles
- Futures
- Cycles
- Volatility
- ZIGZAG
- MESA
- Retracement
- Aroon
INDICATORS LIST
LIST OF TOPICS
PRINT THIS ARTICLE
by David Penn
Deep MACDH troughs and resistance at major long-term moving averages suggest that the correction in cotton futures is not yet done.
Position: N/A
David Penn
Technical Writer for Technical Analysis of STOCKS & COMMODITIES magazine, Working-Money.com, and Traders.com Advantage.
PRINT THIS ARTICLE
MACD
Cotton Keeps Crashing Down
10/14/04 12:08:13 PMby David Penn
Deep MACDH troughs and resistance at major long-term moving averages suggest that the correction in cotton futures is not yet done.
Position: N/A
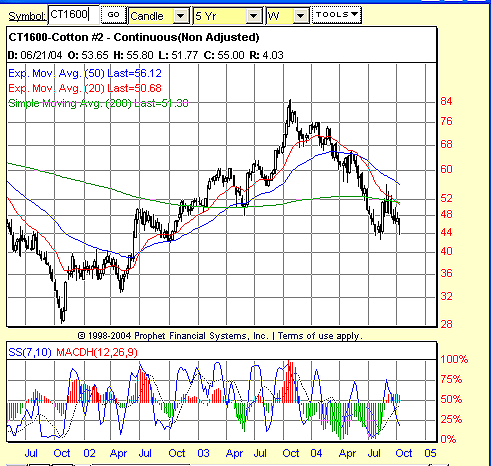
| The last bull market in cotton was a sizable one. Basis continuous futures, cotton in late 2001 began a run that saw prices rally from near 28 cents to more than 84 cents almost exactly two years later. This is the stuff that commodity traders dream of. Even those who waited until cotton broke out in the late spring of 2002 saw prices more than double in a year and a half. In a market in which every cent is worth $500, cotton's bull market put the "appreciation" in price appreciation. |
| But since the bull market ended early in the fourth quarter of 2003, cotton has been as passionately bearish as it was passionately bullish. After falling below the 20-week exponential moving average (EMA) early in 2004 and moving below the 50-week EMA a few short weeks afterward, the bear market in cotton futures was confirmed when prices rallied in the second quarter of 2004 to test both the 20- and 50-week EMAs for resistance. |

|
| Figure 1: The 52 cent mark and a convergence of moving averages provides stiff resistance to cotton’s attempt to rally in the third quarter of 2004. |
| Graphic provided by: Prophet Financial Systems, Inc.. |
| |
| What especially catches my eye in the long-term chart of cotton futures is the deep MACDH trough that developed over the first half of 2004. As I have written about elsewhere, deep MACDH troughs tend to augur deeper declines ahead. Compare, for example, the deep MACDH trough that developed during the last leg of cotton's bear market from the end of 2000 to the autumn of 2001. By the time that MACDH trough bottomed at the end of first-quarter 2001 (January-March), the bear market leg that began in fourth-quarter 2000 was about halfway complete (68 cents to 44 cents en route to 28 cents). In fact, it was a "rally" in the MACDH that set up the last great short opportunity early in third-quarter 2001. |
| A similar scenario might be unfolding in this, the latest cyclical bear market to strike cotton. In this weekly chart of continuous cotton futures, prices rallied in the third quarter (July-September) of 2004 to break back above the 200-week EMA. In fact, cotton prices actually broke above the 50-week EMA -- if only on a brief, intraweek basis. This bounce took place as the MACDH was moving up from major lows. As prices retreat from the 56-cent level, slipping back into the 40s, we see the same modestly positive MACDH that we saw back in the third quarter of 2001 -- right before prices resumed their descent. |
| Looking at the long-term chart, there aren't many areas of likely support for any serious decline in cotton futures. Having broken back below 48 cents, there is some support near 43, and a four-cent trading range between 40 and 36 cents was a six-month obstacle to cotton prices on the way up. But given the variety of other technical developments -- the move below the 200-week SMA, the "turning down" of the 20- and 50- EMAs, and the other factors mentioned previously, a move below the third-quarter 2004 lows just south of 44 cents will probably signify a deeper longer-term move toward a test of the 2001 lows near 28. |
Technical Writer for Technical Analysis of STOCKS & COMMODITIES magazine, Working-Money.com, and Traders.com Advantage.
| Title: | Technical Writer |
| Company: | Technical Analysis, Inc. |
| Address: | 4757 California Avenue SW |
| Seattle, WA 98116 | |
| Phone # for sales: | 206 938 0570 |
| Fax: | 206 938 1307 |
| Website: | www.Traders.com |
| E-mail address: | DPenn@traders.com |
Traders' Resource Links | |
| Charting the Stock Market: The Wyckoff Method -- Books | |
| Working-Money.com -- Online Trading Services | |
| Traders.com Advantage -- Online Trading Services | |
| Technical Analysis of Stocks & Commodities -- Publications and Newsletters | |
| Working Money, at Working-Money.com -- Publications and Newsletters | |
| Traders.com Advantage -- Publications and Newsletters | |
| Professional Traders Starter Kit -- Software | |
Click here for more information about our publications!
Comments
Date: 10/19/04Rank: 5Comment:
Date: 10/23/04Rank: 2Comment:

Request Information From Our Sponsors
- VectorVest, Inc.
- Executive Premier Workshop
- One-Day Options Course
- OptionsPro
- Retirement Income Workshop
- Sure-Fire Trading Systems (VectorVest, Inc.)
- Trading as a Business Workshop
- VectorVest 7 EOD
- VectorVest 7 RealTime/IntraDay
- VectorVest AutoTester
- VectorVest Educational Services
- VectorVest OnLine
- VectorVest Options Analyzer
- VectorVest ProGraphics v6.0
- VectorVest ProTrader 7
- VectorVest RealTime Derby Tool
- VectorVest Simulator
- VectorVest Variator
- VectorVest Watchdog
- StockCharts.com, Inc.
- Candle Patterns
- Candlestick Charting Explained
- Intermarket Technical Analysis
- John Murphy on Chart Analysis
- John Murphy's Chart Pattern Recognition
- John Murphy's Market Message
- MurphyExplainsMarketAnalysis-Intermarket Analysis
- MurphyExplainsMarketAnalysis-Visual Analysis
- StockCharts.com
- Technical Analysis of the Financial Markets
- The Visual Investor
