HOT TOPICS LIST
- MACD
- Fibonacci
- RSI
- Gann
- ADXR
- Stochastics
- Volume
- Triangles
- Futures
- Cycles
- Volatility
- ZIGZAG
- MESA
- Retracement
- Aroon
INDICATORS LIST
LIST OF TOPICS
PRINT THIS ARTICLE
by Sean Moore
Trends in market volume can provide helpful insight into market activity. One effective way to recognize these volume trends is with the use of a volume oscillator.
Position: N/A
Sean Moore
Traders.com Staff Writer.
PRINT THIS ARTICLE
VOLUME OSCILLATOR
Taking Advantage Of Market Volume
05/26/00 01:20:44 PMby Sean Moore
Trends in market volume can provide helpful insight into market activity. One effective way to recognize these volume trends is with the use of a volume oscillator.
Position: N/A
| A market's volume is commonly looked at as a key indicator when making decisions on whether to buy or sell a certain security. The volume of a security is often charted as a series of histograms displayed below the price data. Rising volume along with rising price will often lead to large upswings, while declining volume and rising price often denotes an oversold market that is ready for a reversal. An effective method for detecting these volume trends is to use a volume oscillator. |
| The volume oscillator can be used to determine whether volume is rising or declining. It looks at the difference between two moving averages of the daily volume, and is calculated using the following equation: Short Volume moving average (MA) - Long Volume MA This is similar to using a 2-line moving average on price data. An indication that volume is increasing is evident when the oscillator value is positive, which means the shorter-length MA has crossed above the longer-length MA. If both price and volume are rising, this presents a favorable market condition. If price is declining and volume is rising, however, then the market is most likely being influenced by strong selling. |

|
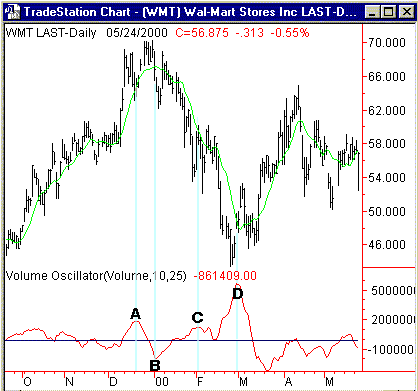
| Figure 1: Daily price data for Wal-Mart Stores Inc. plotted with the volume oscillator. |
| Graphic provided by: TradeStation. |
| |
| Figure 1 shows the daily price bars for Wal-Mart Inc. (WMT) along with the volume oscillator using 10- and 25-day moving averages for the daily volume data. When the oscillator is above the zero-line (horizontal dark blue line), volume is increasing. Trends can also be drawn on this volume oscillator and compared to the price trends. Notice on the chart the upswing that occurred between October 1999 and January 2000, followed by a significant correction from January to late February 2000. During the upswing the volume oscillator hovered fairly close to the zero line, staying above the zero line for much of the time. During this time, the most significant change occurred from points A to B, with declining volume indicating that the market may have been overbought. Then from points B to C, the volume oscillator steadily increased, while the price decreased. This was a negative indication signaling that the market was headed downward. There was a large positive volume change up to point D as the support at the 45 level was tested and the market readied for its next move upward. |
| Comparing the trend in price to the direction of the volume oscillator can give you an inside edge when developing your trading strategy. Increasing volume can be a great sign in a bull run but detrimental in a bear decline. Additionally, changes to volume trend, which become clearer with the use of a volume oscillator, can be another sign that a reversal is imminent. |
Traders.com Staff Writer.
| Title: | Project Engineer |
| Company: | Technical Analysis, Inc. |
| Address: | 4757 California Ave. SW |
| Seattle, WA 98116 | |
| Phone # for sales: | 206 938 0570 |
| Fax: | 206 938 1307 |
| Website: | Traders.com |
| E-mail address: | smoore@traders.com |
Traders' Resource Links | |
| Charting the Stock Market: The Wyckoff Method -- Books | |
| Working-Money.com -- Online Trading Services | |
| Traders.com Advantage -- Online Trading Services | |
| Technical Analysis of Stocks & Commodities -- Publications and Newsletters | |
| Working Money, at Working-Money.com -- Publications and Newsletters | |
| Traders.com Advantage -- Publications and Newsletters | |
| Professional Traders Starter Kit -- Software | |
Click here for more information about our publications!
Comments
Date: / /Rank: 5Comment: nice and practical
Date: / /Rank: 4Comment: Where is the source of on balance volume,MACD etal other data on stocks. I do not have the time or data to compute same.
I want to employ these techniques but seek the input values

Request Information From Our Sponsors
- StockCharts.com, Inc.
- Candle Patterns
- Candlestick Charting Explained
- Intermarket Technical Analysis
- John Murphy on Chart Analysis
- John Murphy's Chart Pattern Recognition
- John Murphy's Market Message
- MurphyExplainsMarketAnalysis-Intermarket Analysis
- MurphyExplainsMarketAnalysis-Visual Analysis
- StockCharts.com
- Technical Analysis of the Financial Markets
- The Visual Investor
- VectorVest, Inc.
- Executive Premier Workshop
- One-Day Options Course
- OptionsPro
- Retirement Income Workshop
- Sure-Fire Trading Systems (VectorVest, Inc.)
- Trading as a Business Workshop
- VectorVest 7 EOD
- VectorVest 7 RealTime/IntraDay
- VectorVest AutoTester
- VectorVest Educational Services
- VectorVest OnLine
- VectorVest Options Analyzer
- VectorVest ProGraphics v6.0
- VectorVest ProTrader 7
- VectorVest RealTime Derby Tool
- VectorVest Simulator
- VectorVest Variator
- VectorVest Watchdog
