HOT TOPICS LIST
- MACD
- Fibonacci
- RSI
- Gann
- ADXR
- Stochastics
- Volume
- Triangles
- Futures
- Cycles
- Volatility
- ZIGZAG
- MESA
- Retracement
- Aroon
INDICATORS LIST
LIST OF TOPICS
PRINT THIS ARTICLE
by Kevin Hopson
Gold is showing signs of a short-term top, but weakness should be bought.
Position: Accumulate
Kevin Hopson
Kevin has been a technical analyst for roughly 10 years now. Previously, Kevin owned his own business and acted as a registered investment advisor, specializing in energy. He was also a freelance oil analyst for Orient Trading Co., a commodity futures trading firm in Japan. Kevin is currently a freelance writer.
PRINT THIS ARTICLE
GOLD & METALS
Where Should You Buy Gold?
10/14/04 09:31:38 AMby Kevin Hopson
Gold is showing signs of a short-term top, but weakness should be bought.
Position: Accumulate
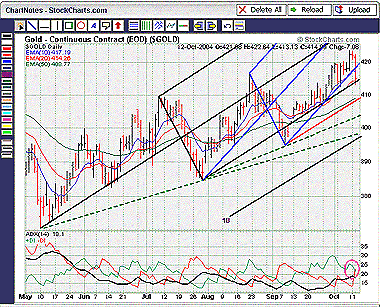
| The continuous gold contract ($GOLD) recently breached the bottom parallel line of the blue pitchfork, as illustrated in the six-month chart. This was expected, as a failure to test the blue median line prior to testing the bottom parallel line (price failure rule) indicated a break of support here. In addition, the average directional movement index (ADX) trend indicator has started to turn negative. More specifically, note how the green (positive) line is beginning to cross below the red (negative) line. This indicates a possible change in the short-term trend. |
| However, as you can see in the chart, previous corrections have been short-lived. Why? The long-term uptrend remains intact and the path of least resistance is still higher. As a result, I would focus on three key support levels as opportune places to buy gold if the selling pressure continues. For example, the first major support level comes into play around $409. This is the site of the contract's 50-day moving average, the red warning line, the 50% retracement level from the September to October rally and the 38.2% retracement level from the July to October rally. |

|
| Figure 1: Gold continuous contract |
| Graphic provided by: StockCharts.com. |
| |
| The second support level comes into play around $404. This is the site of July's uptrend line, the 50% retracement level from the July to October rally and the 38.2% retracement level from the May to October rally. |
| The third and final support level comes into play around $398. This is the site of May's uptrend line, the 1B channel line, the 61.8% retracement level from the July to October rally and the 50% retracement level from the May to October rally. As you can see, there is a significant amount of confluence at each of these support levels, making them good places to buy. |
Kevin has been a technical analyst for roughly 10 years now. Previously, Kevin owned his own business and acted as a registered investment advisor, specializing in energy. He was also a freelance oil analyst for Orient Trading Co., a commodity futures trading firm in Japan. Kevin is currently a freelance writer.
| Glen Allen, VA | |
| E-mail address: | hopson_1@yahoo.com |
Click here for more information about our publications!
Comments
Date: 10/15/04Rank: 4Comment:
Date: 10/23/04Rank: 3Comment:

Request Information From Our Sponsors
- StockCharts.com, Inc.
- Candle Patterns
- Candlestick Charting Explained
- Intermarket Technical Analysis
- John Murphy on Chart Analysis
- John Murphy's Chart Pattern Recognition
- John Murphy's Market Message
- MurphyExplainsMarketAnalysis-Intermarket Analysis
- MurphyExplainsMarketAnalysis-Visual Analysis
- StockCharts.com
- Technical Analysis of the Financial Markets
- The Visual Investor
- VectorVest, Inc.
- Executive Premier Workshop
- One-Day Options Course
- OptionsPro
- Retirement Income Workshop
- Sure-Fire Trading Systems (VectorVest, Inc.)
- Trading as a Business Workshop
- VectorVest 7 EOD
- VectorVest 7 RealTime/IntraDay
- VectorVest AutoTester
- VectorVest Educational Services
- VectorVest OnLine
- VectorVest Options Analyzer
- VectorVest ProGraphics v6.0
- VectorVest ProTrader 7
- VectorVest RealTime Derby Tool
- VectorVest Simulator
- VectorVest Variator
- VectorVest Watchdog
