HOT TOPICS LIST
- MACD
- Fibonacci
- RSI
- Gann
- ADXR
- Stochastics
- Volume
- Triangles
- Futures
- Cycles
- Volatility
- ZIGZAG
- MESA
- Retracement
- Aroon
INDICATORS LIST
LIST OF TOPICS
PRINT THIS ARTICLE
by Chris Manuell
Oil has had a remarkable spurt higher in recent days and appears to be the engine of the financial markets. However, a combination of indicators suggests that a correction is nigh.
Position: N/A
Chris Manuell
Chris Manuell spent 7 years as a futures sales/trader for a large investment bank and more recently as a technical analyst for an independent research company. He has a bachelor of economics and graduate diploma in applied finance & investment. Currently enrolled in the CMT program with the MTA.
PRINT THIS ARTICLE
BULL/BEAR MARKET
Texas Tea Top?
10/13/04 08:23:41 AMby Chris Manuell
Oil has had a remarkable spurt higher in recent days and appears to be the engine of the financial markets. However, a combination of indicators suggests that a correction is nigh.
Position: N/A
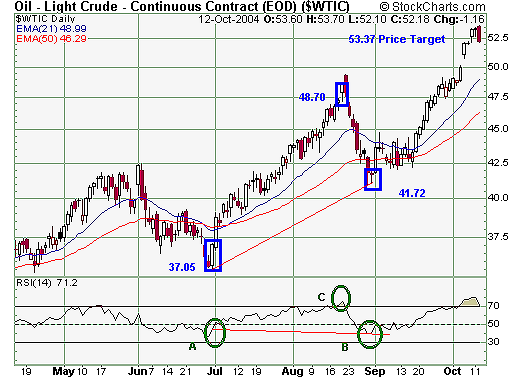
 Figure 1: Oil, Continuous Contract (EOD) Graphic: StockCharts.com Oil recently reached a price target of 53.37, which was calculated from a relative strength index (RSI) pattern called a "positive reversal." Constance Brown, in her excellent book TECHNICAL ANALYSIS FOR THE TRADING PROFESSIONAL, devotes a chapter to deriving price targets from positive and negative reversals in the RSI, which where introduced to her by Andrew Cardwell. Essentially, a positive reversal occurs when the RSI develops a lower trough while prices are at corresponding higher levels; the lower RSI is out of tune with the higher price level. This is demonstrated on the oil chart with the RSI trough at B, lower than A -- the corresponding price levels are higher. The RSI peak between the troughs is marked C on the chart. |
| The closing prices from these three RSI points can then be used to calculate a price projection from the positive reversal signal. The formula is (B - A) + C = New price objective. Taking oil, we can calculate a price target from the closing prices. The closing price of A on July 1 was 37.05; B closed at 41.72 on August 31, and the RSI peak at C on August 19 had a closing price of 48.70. Therefore, the price target for oil is (41.72 - 37.05) + 48.70 = 53.37. Oil met this target on October 11 and subsequently surpassed the level. Having achieved this target, traders can now wait for any potential reversal signals that appear in oil. |

|
| Figure 2: Oil, continuous contract |
| Graphic provided by: StockCharts.com. |
| |
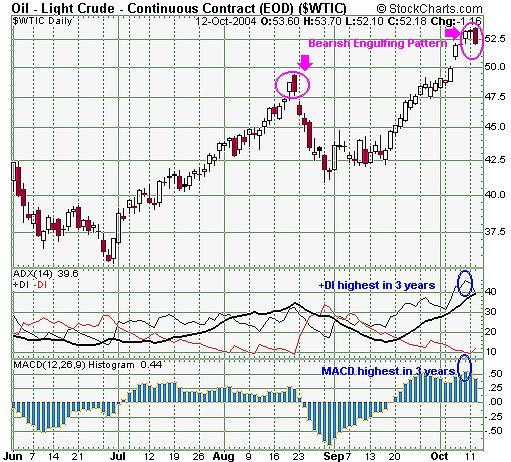
| On October 12 oil completed a bearish engulfing pattern, which is a bearish candlestick pattern surfacing after an uptrend. The market opens above the prior session's close and envelops the body of that session to close lower. Oil in fact engulfed the bodies of the two prior sessions, strengthening the pattern. The bullish engulfing pattern tends to work more effectively following a sharp rally and results in a swing lower. Oil completed a bullish engulfing pattern on August 20, which resulted in a minor correction. |
| The technical indicators also demonstrate an overextended market with the positive directional indicator and the moving average convergence/divergence (MACD) histogram at their highest levels in over three years. The slope of the MACD histogram has also recently turned down from its extreme level, which suggests that the bull's momentum is waning. |
| Seasonal patterns also favor a potential top. As analyst John Murphy elucidates in TECHNICAL ANALYSIS OF THE FINANCIAL MARKETS, petroleum products have an inclination to peak during October. |
Chris Manuell spent 7 years as a futures sales/trader for a large investment bank and more recently as a technical analyst for an independent research company. He has a bachelor of economics and graduate diploma in applied finance & investment. Currently enrolled in the CMT program with the MTA.
| E-mail address: | chrismanuell5@yahoo.co.uk |
Click here for more information about our publications!
Comments
Date: 10/13/04Rank: 5Comment:
Date: 10/19/04Rank: 5Comment:
Date: 10/23/04Rank: 4Comment:

Request Information From Our Sponsors
- StockCharts.com, Inc.
- Candle Patterns
- Candlestick Charting Explained
- Intermarket Technical Analysis
- John Murphy on Chart Analysis
- John Murphy's Chart Pattern Recognition
- John Murphy's Market Message
- MurphyExplainsMarketAnalysis-Intermarket Analysis
- MurphyExplainsMarketAnalysis-Visual Analysis
- StockCharts.com
- Technical Analysis of the Financial Markets
- The Visual Investor
- VectorVest, Inc.
- Executive Premier Workshop
- One-Day Options Course
- OptionsPro
- Retirement Income Workshop
- Sure-Fire Trading Systems (VectorVest, Inc.)
- Trading as a Business Workshop
- VectorVest 7 EOD
- VectorVest 7 RealTime/IntraDay
- VectorVest AutoTester
- VectorVest Educational Services
- VectorVest OnLine
- VectorVest Options Analyzer
- VectorVest ProGraphics v6.0
- VectorVest ProTrader 7
- VectorVest RealTime Derby Tool
- VectorVest Simulator
- VectorVest Variator
- VectorVest Watchdog
