HOT TOPICS LIST
- MACD
- Fibonacci
- RSI
- Gann
- ADXR
- Stochastics
- Volume
- Triangles
- Futures
- Cycles
- Volatility
- ZIGZAG
- MESA
- Retracement
- Aroon
INDICATORS LIST
LIST OF TOPICS
PRINT THIS ARTICLE
by Chris Manuell
In recent days, the Philadelphia Semiconductor Index (SOX) has enjoyed a mild corrective bounce from its long-term support zone.
Position: N/A
Chris Manuell
Chris Manuell spent 7 years as a futures sales/trader for a large investment bank and more recently as a technical analyst for an independent research company. He has a bachelor of economics and graduate diploma in applied finance & investment. Currently enrolled in the CMT program with the MTA.
PRINT THIS ARTICLE
TECHNICAL ANALYSIS
A Pair Of SOX
10/12/04 08:41:41 AMby Chris Manuell
In recent days, the Philadelphia Semiconductor Index (SOX) has enjoyed a mild corrective bounce from its long-term support zone.
Position: N/A
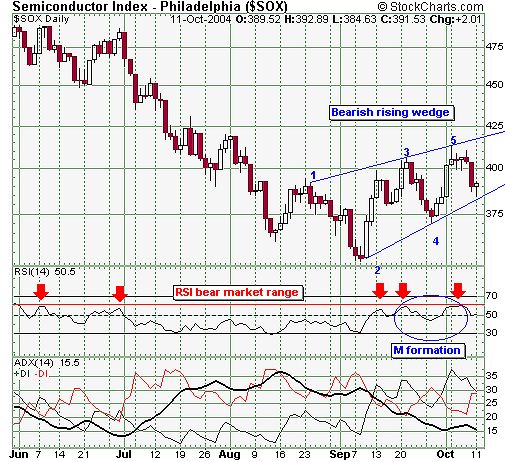
| In recent days, the Philadelphia Semiconductor Index (SOX) has enjoyed a mild corrective bounce from its long-term support zone at 350 ("SOX Bounces From Turning Point," 9/13/04), although recent price action makes it difficult to ascertain if the correction will be sustained (see Figure 1). |
| The SOX has developed a potential bearish rising wedge, which could result in a retest of the yearly lows at the important 350-level support region. The main characteristic of the rising wedge is two rising trendlines that are converging and will eventually intersect. The SOX completes the minimum requirement of five trendline touches, with three on the upper trendline and two on the lower trendline. In order to trade this formation, it is advisable to wait for a downside breakout -- with a close beneath the lower trendline -- which would increase the confidence of the trade. Prices usually fall sharply, and a minimum objective is the bottom of the formation, which in the case of the SOX would be in the 350 region. |

|
| Figure 1: Philadelphia Semiconductor Index. The SOX has enjoyed a mild correction in recent days. |
| Graphic provided by: StockCharts.com. |
| |
| The behavior of the relative strength index (RSI) since June clarifies that the SOX has remained in a bear market. In TECHNICAL ANALYSIS FOR THE TRADING PROFESSIONAL, Constance Brown highlights that oscillators such as RSI don't necessarily move between zero and 100 and provides a "general rule" that in a bear market the RSI will have an "upper resistance zone of 55 to 65." The SOX chart illustrates that RSI has indeed struggled to push through this zone. The RSI is also currently developing an "M" formation following its most recent failure to breach the 65 zone; a move beneath the intervening trough would complete the bearish RSI pattern. This would augment a sharp move lower following the breach of the lower trendline on the bearish rising wedge. The average directional movement index (ADX) has remained on a downward trajectory since mid-August, which corresponds with the development of the rising wedge. |
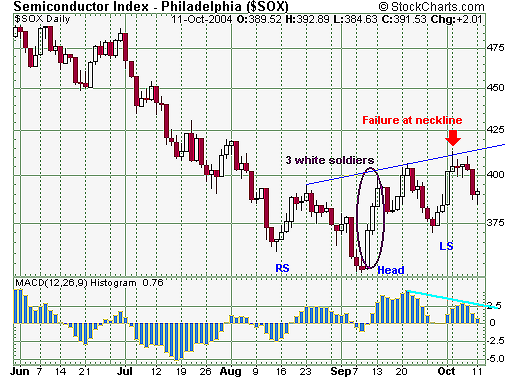
| SOX bulls hoping for a reversal from the yearly downtrend would have lost confidence with the recent failure of the market to complete a reverse head and shoulders pattern. The potential pattern unfolded, following a sharp bounce from the 350 region that formed a potential head and also marked the emergence of the three white soldiers reversal pattern. The three white soldiers is a posse of three long white candles with consecutively higher closes. In JAPANESE CANDLESTICK CHARTING TECHNIQUES, Steve Nison notes "on corrections, the first or second white candle that started the three white soldiers is often support." The low of the second soldier did provide support on September 28 and also allowed the right shoulder of the potential head and shoulders to form. See Figure 2.  Figure 2: Philadelphia Semiconductor Index |
| The SOX then bounced from the left shoulder; however, momentum failed to allow a sustained breach of the neckline -- October 4 marked a rejection. The negative divergence in the daily moving average convergence/divergence (MACD) histogram demonstrates the bullish fatigue. A close above the neckline would complete the bullish head and shoulders, allowing the recent bounce from the 350 region to continue. In summary, the SOX is at that critical stage of a trend -- continuation or reversal -- with two patterns unfolding, which may act as a navigational tool for which path is taken. |
Chris Manuell spent 7 years as a futures sales/trader for a large investment bank and more recently as a technical analyst for an independent research company. He has a bachelor of economics and graduate diploma in applied finance & investment. Currently enrolled in the CMT program with the MTA.
| E-mail address: | chrismanuell5@yahoo.co.uk |
Click here for more information about our publications!
Comments
Date: 10/12/04Rank: 3Comment:
Date: 10/26/04Rank: 5Comment:

Request Information From Our Sponsors
- VectorVest, Inc.
- Executive Premier Workshop
- One-Day Options Course
- OptionsPro
- Retirement Income Workshop
- Sure-Fire Trading Systems (VectorVest, Inc.)
- Trading as a Business Workshop
- VectorVest 7 EOD
- VectorVest 7 RealTime/IntraDay
- VectorVest AutoTester
- VectorVest Educational Services
- VectorVest OnLine
- VectorVest Options Analyzer
- VectorVest ProGraphics v6.0
- VectorVest ProTrader 7
- VectorVest RealTime Derby Tool
- VectorVest Simulator
- VectorVest Variator
- VectorVest Watchdog
- StockCharts.com, Inc.
- Candle Patterns
- Candlestick Charting Explained
- Intermarket Technical Analysis
- John Murphy on Chart Analysis
- John Murphy's Chart Pattern Recognition
- John Murphy's Market Message
- MurphyExplainsMarketAnalysis-Intermarket Analysis
- MurphyExplainsMarketAnalysis-Visual Analysis
- StockCharts.com
- Technical Analysis of the Financial Markets
- The Visual Investor
