HOT TOPICS LIST
- MACD
- Fibonacci
- RSI
- Gann
- ADXR
- Stochastics
- Volume
- Triangles
- Futures
- Cycles
- Volatility
- ZIGZAG
- MESA
- Retracement
- Aroon
INDICATORS LIST
LIST OF TOPICS
PRINT THIS ARTICLE
by Kevin Hopson
Until investors become more optimistic on oil services stocks, this group has higher to go.
Position: Hold
Kevin Hopson
Kevin has been a technical analyst for roughly 10 years now. Previously, Kevin owned his own business and acted as a registered investment advisor, specializing in energy. He was also a freelance oil analyst for Orient Trading Co., a commodity futures trading firm in Japan. Kevin is currently a freelance writer.
PRINT THIS ARTICLE
TECHNICAL ANALYSIS
Why Oil Service Stocks Are Still The Place To Be
10/08/04 01:19:36 PMby Kevin Hopson
Until investors become more optimistic on oil services stocks, this group has higher to go.
Position: Hold
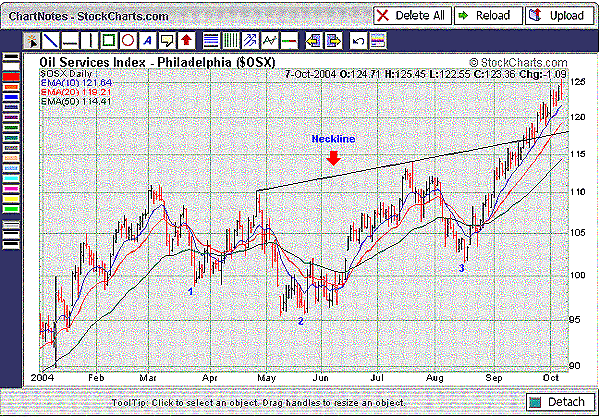
| I touched on the Oil Services Index (OSX) a few weeks ago, citing an inverse head-and-shoulders pattern as a reason for higher prices. As you can see in the year-to-date chart, the index breached resistance along the neckline, confirming an upside breakout in the process. As I stated in my previous article, an estimated price target for the index is 130-132. I calculated this by taking the distance from the completion point of the left shoulder to the bottom-most point of the head and then adding this number (110-96=14) to the breakout point (118+14=132). Just to note, the numbers 1, 2, and 3 illustrate the left shoulder, head, and right shoulder, respectively. |
| Since the index has already made its way up to the 125 level, you might think that the near-term upside potential is limited. However, there are a few things you should know before jumping to this conclusion. For one thing, price targets are just goals. Just because a price target is met does not mean this price level will act as an ultimate top (or bottom). In addition, market sentiment toward the oil services group continues to be overly pessimistic. More specifically, the put/call open interest ratio (front three months) for the index is roughly 2.0x, which is above 95% of the readings for the past year. This means investors have been piling into put options in anticipation of a reversal. In case you are not aware, tops tend to occur when investor sentiment is at its highest (most bullish). Because this ratio has been spiking higher during the recent rally, there is no sign of a significant top developing yet. See Figure 1. |

|
| Figure 1: Oil Services Index |
| Graphic provided by: StockCharts.com. |
| |
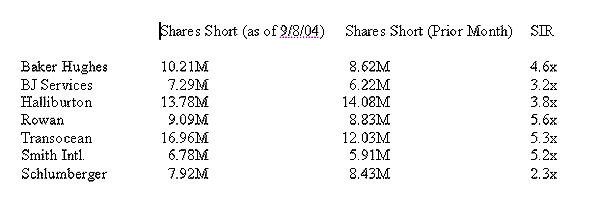
If you look at short interest, you will see a similar picture. For example, note how many of the big companies (which are components of the OSX) failed to see a significant decline in short interest last month. In fact, most of these companies actually saw a rise in short interest. Companies like Baker Hughes, Rowan, Transocean and Smith International continue to have high short interest ratios (SIR). As a result, there is a lot of potential buying pressure to push these stocks -- and the related index -- higher. See Figure 2. Figure 2: Oil Companies Short Interest |
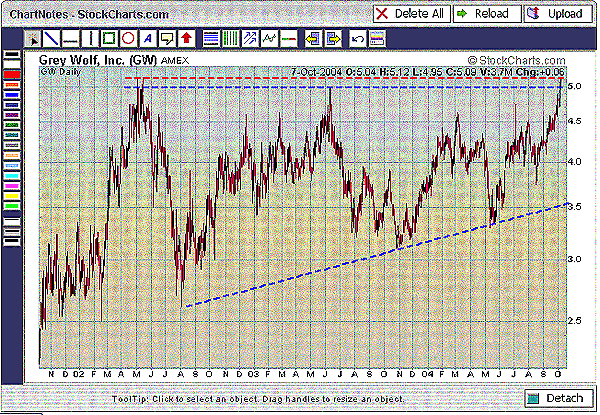
If you want to take advantage of the oil services sector but do not want to go the holders route (Oil Service HOLDRs -- OIH), I would consider an investment in Grey Wolf (GW). Though Grey Wolf is not a member of the OSX, the company has the potential to move significantly higher. This is because Grey Wolf is still in a long-term bullish pattern, whereas most other oil service companies have already broken out of these patterns, whether they are trading ranges or ascending triangles. As you can see in the three-year chart, Grey Wolf is currently testing the top of a long-term ascending triangle formation. Ascending triangles normally break to the upside so the stock could see a significant breakout if the $5.00 level is taken out with authority. More specifically, Grey Wolf could eventually make its way up to the $7.50 level. I calculated this price target by taking the base of the triangle (high point minus low point) and adding this figure ($5.10-$2.60=$2.50) to the potential breakout point ($5.10+$2.50=$7.60). Because Grey Wolf has a substantial amount of short interest (16.6 million shares or 15x normal daily volume), there is significant buying pressure to push the stock higher. See Figure 3. Figure 3: Grey Wolf. Note the bullish pattern. |
Kevin has been a technical analyst for roughly 10 years now. Previously, Kevin owned his own business and acted as a registered investment advisor, specializing in energy. He was also a freelance oil analyst for Orient Trading Co., a commodity futures trading firm in Japan. Kevin is currently a freelance writer.
| Glen Allen, VA | |
| E-mail address: | hopson_1@yahoo.com |
Click here for more information about our publications!
Comments
Date: 10/11/04Rank: 5Comment:
Date: 10/14/04Rank: 5Comment:

Request Information From Our Sponsors
- StockCharts.com, Inc.
- Candle Patterns
- Candlestick Charting Explained
- Intermarket Technical Analysis
- John Murphy on Chart Analysis
- John Murphy's Chart Pattern Recognition
- John Murphy's Market Message
- MurphyExplainsMarketAnalysis-Intermarket Analysis
- MurphyExplainsMarketAnalysis-Visual Analysis
- StockCharts.com
- Technical Analysis of the Financial Markets
- The Visual Investor
- VectorVest, Inc.
- Executive Premier Workshop
- One-Day Options Course
- OptionsPro
- Retirement Income Workshop
- Sure-Fire Trading Systems (VectorVest, Inc.)
- Trading as a Business Workshop
- VectorVest 7 EOD
- VectorVest 7 RealTime/IntraDay
- VectorVest AutoTester
- VectorVest Educational Services
- VectorVest OnLine
- VectorVest Options Analyzer
- VectorVest ProGraphics v6.0
- VectorVest ProTrader 7
- VectorVest RealTime Derby Tool
- VectorVest Simulator
- VectorVest Variator
- VectorVest Watchdog
