HOT TOPICS LIST
- MACD
- Fibonacci
- RSI
- Gann
- ADXR
- Stochastics
- Volume
- Triangles
- Futures
- Cycles
- Volatility
- ZIGZAG
- MESA
- Retracement
- Aroon
INDICATORS LIST
LIST OF TOPICS
PRINT THIS ARTICLE
by Chris Manuell
Recently, three big US-based oil companies demonstrated candlestick reversal patterns at the same time. What's that signify?
Position: N/A
Chris Manuell
Chris Manuell spent 7 years as a futures sales/trader for a large investment bank and more recently as a technical analyst for an independent research company. He has a bachelor of economics and graduate diploma in applied finance & investment. Currently enrolled in the CMT program with the MTA.
PRINT THIS ARTICLE
CANDLESTICK CHARTING
Oil Stocks And Oil
10/08/04 01:15:25 PMby Chris Manuell
Recently, three big US-based oil companies demonstrated candlestick reversal patterns at the same time. What's that signify?
Position: N/A
| The price of oil exhibits a strong relationship with oil shares, so it makes sense to monitor oil shares on an individual basis to gauge the direction of the oil price. Three big US oil companies all demonstrated candlestick reversal patterns simultaneously. |
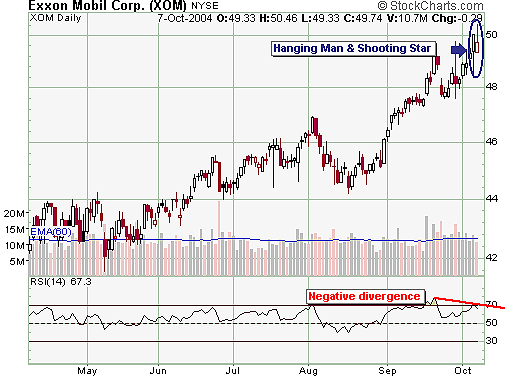
| Exxon Mobil (XOM) completed a textbook hanging man formation on October 6. The hanging man is the bearish counterpart to the hammer with a long lower shadow and a close on the high; however, it follows a rally, not a decline. The hanging man is the ugly sister to the hammer, as it is often forgotten and requires more confirmation than the hammer. The personality of the hanging man explains this -- the long lower shadow representing demand on the lows. The credibility of the XOM hanging man is improved with the stock trading at historical highs. See Figure 1. |

|
| Figure 1: Exxon Mobil Corp. |
| Graphic provided by: StockCharts.com. |
| |
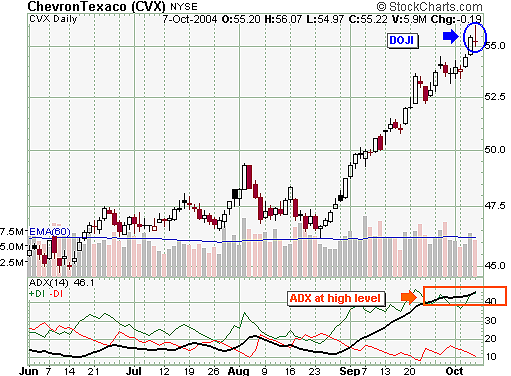
| Nervous trading remained in the stock around the 50 level, with the following session in XOM completing a bearish shooting star. The shooting star on October 7 matched the reversal patterns criteria with a long upper shadow and small real body at the bottom of the trading range. The long upper shadow showed a rejection of prices above the 50 level. The bearish candlestick signals are also supported by a negative divergence in the relative strength index (RSI), which also emerges at extreme levels -- above 70 on the upper reference line. These signs suggest that XOM is overextended and could be due for a minor pullback from the strong rally that has surfaced since mid-August. Chevron Texaco (CVX) joined in on the candlestick act on October 7, completing a dangerous doji. The doji is a candle session where the opening and closing price levels are similar, reflecting indecison by market participants. The doji is highly regarded in the candlestick community and considered a distinct trend change signal. This pattern is particularly potent in calling tops. The probability of the Chevron Texaco doji marking a turning point would be increased with some subsequent bearish candles. The high average directional movement index (ADX) level, only had a higher ADX reading on three occasions in the last three years, suggests that the trend has the potential to weaken. A turndown in the ADX would allow for the market to pause and "catch its breath." See Figure 2.  Figure 2: Chevron |
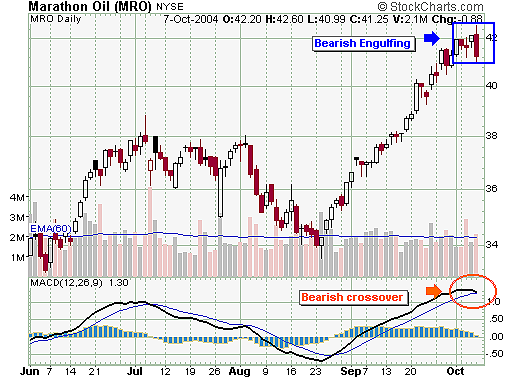
Marathon Oil (MRO) is the third oil company to complete a bearish candlestick pattern on the daily charts on October 7. MRO completed a bearish engulfing pattern, which is a major candlestick reversal pattern composed of two opposite colored bodies. The second candle should engulf the prior body. Marathon Oil's black body on October 7 enveloped the small white body from October 6. See Figure 3.  Figure 3: Marathon Oil. |
| The likelihood of this pattern marking a high is heightened by a couple of factors. First, the engulfing body from October 7 consumes not just the prior body but four prior ones. Second, the pattern has emerged after a swift rally from August 23, making it vulnerable to profit taking. The moving average convergence/divergence (MACD) is also poised to complete a bearish crossover, which would accelerate a potential retracement. In summary, three major US oil companies completed different bearish candlestick reversal patterns in conjunction, which may result in a short-term retracement and also provide a cautionary note to oil prices. Further, contrarian traders may also take pleasure from the recent Bloomberg News Survey ("Oil May Rise From Record on US Supply, Survey Shows," October 8) where 33 of 45 traders and analysts, or 73%, predicted an increase in New York oil futures next week. The largest margin supporting a rally in the six months the survey has been in progress. |
Chris Manuell spent 7 years as a futures sales/trader for a large investment bank and more recently as a technical analyst for an independent research company. He has a bachelor of economics and graduate diploma in applied finance & investment. Currently enrolled in the CMT program with the MTA.
| E-mail address: | chrismanuell5@yahoo.co.uk |
Click here for more information about our publications!
Comments
Date: 10/11/04Rank: 5Comment:

Request Information From Our Sponsors
- VectorVest, Inc.
- Executive Premier Workshop
- One-Day Options Course
- OptionsPro
- Retirement Income Workshop
- Sure-Fire Trading Systems (VectorVest, Inc.)
- Trading as a Business Workshop
- VectorVest 7 EOD
- VectorVest 7 RealTime/IntraDay
- VectorVest AutoTester
- VectorVest Educational Services
- VectorVest OnLine
- VectorVest Options Analyzer
- VectorVest ProGraphics v6.0
- VectorVest ProTrader 7
- VectorVest RealTime Derby Tool
- VectorVest Simulator
- VectorVest Variator
- VectorVest Watchdog
- StockCharts.com, Inc.
- Candle Patterns
- Candlestick Charting Explained
- Intermarket Technical Analysis
- John Murphy on Chart Analysis
- John Murphy's Chart Pattern Recognition
- John Murphy's Market Message
- MurphyExplainsMarketAnalysis-Intermarket Analysis
- MurphyExplainsMarketAnalysis-Visual Analysis
- StockCharts.com
- Technical Analysis of the Financial Markets
- The Visual Investor
