HOT TOPICS LIST
- MACD
- Fibonacci
- RSI
- Gann
- ADXR
- Stochastics
- Volume
- Triangles
- Futures
- Cycles
- Volatility
- ZIGZAG
- MESA
- Retracement
- Aroon
INDICATORS LIST
LIST OF TOPICS
PRINT THIS ARTICLE
by Chris Manuell
The Japanese financial markets are a technician's ideal stage. The Nikkei is no exception and is currently manifesting a symmetrical triangle formation.
Position: N/A
Chris Manuell
Chris Manuell spent 7 years as a futures sales/trader for a large investment bank and more recently as a technical analyst for an independent research company. He has a bachelor of economics and graduate diploma in applied finance & investment. Currently enrolled in the CMT program with the MTA.
PRINT THIS ARTICLE
TRIANGLES
The Nikkei's Potential Triangle
10/07/04 03:49:46 PMby Chris Manuell
The Japanese financial markets are a technician's ideal stage. The Nikkei is no exception and is currently manifesting a symmetrical triangle formation.
Position: N/A
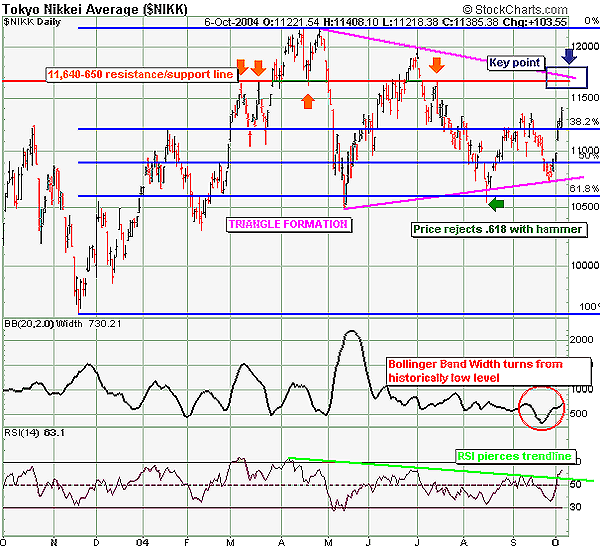
| The Japanese financial markets are a technician's ideal stage, akin to a surfer plying their skills in Hawaii, as they are a technically oriented market. The Nikkei is no exception and is currently manifesting a symmetrical triangle formation. |
| The symmetrical triangle is considered a continuation pattern, with a pause in activity from the prior trend resulting in sideways price action. The triangle is marked by converging trendlines -- an upper trendline and lower trendline -- which captures the preceding price action. The starting point is where the prior trend halts, which in the case of the Nikkei was in late April. The minimum requirement for a triangle is four reversal points, which has been satisfied by the Nikkei. The market did penetrate the lower trendline on August 16, but the sharp rejection, exhibited by a hammer formation, reinforced the importance of that lower trendline. The significance of the August 16th hammer was also demonstrated by the rejection of the 0.618 Fibonacci retracement region of the November-April rally. John Bollinger discusses the predictive value of utilizing the width of Bollinger Bands in his book, BOLLINGER ON BOLLINGER BANDS. When the band width (BWI) falls to a very low level, the Nikkei BWI has recently dipped to its lowest level in more than three years; volatility has tailed off, indicating that a major move of some sort could occur in the near future. This fits the profile of the developing symmetrical triangle in the Nikkei. |

|
| Figure 1: The Nikkei average |
| Graphic provided by: StockCharts.com. |
| |
| The relative strength index (RSI) tends to break its trendlines ahead of prices, and the Nikkei has recently pierced its RSI downtrend line from early April, which may give the bulls confidence if prices approach the upper trendline of the symmetrical triangle. |
| Completion of the triangle would require a close above the upper trendline and signal that the bullish trend would resume. The upper trendline also appears on target to intersect with the significant resistance/support line in the 11,640-650 region; this intersection point may determine the medium-term future of the Nikkei. |
| A successful triangle would enable a minimum objective for the Nikkei to be derived, calculated by adding the height of the vertical line at the widest part of the triangle to the breakout point. The height of the Nikkei triangle is achieved by subtracting the low from May 17, at 10,490, from the high on April 26 at 12,196. A rally of 1,706 points from the breakout point would be impressive. |
Chris Manuell spent 7 years as a futures sales/trader for a large investment bank and more recently as a technical analyst for an independent research company. He has a bachelor of economics and graduate diploma in applied finance & investment. Currently enrolled in the CMT program with the MTA.
| E-mail address: | chrismanuell5@yahoo.co.uk |
Click here for more information about our publications!
Comments
Date: 10/11/04Rank: 4Comment:

Request Information From Our Sponsors
- VectorVest, Inc.
- Executive Premier Workshop
- One-Day Options Course
- OptionsPro
- Retirement Income Workshop
- Sure-Fire Trading Systems (VectorVest, Inc.)
- Trading as a Business Workshop
- VectorVest 7 EOD
- VectorVest 7 RealTime/IntraDay
- VectorVest AutoTester
- VectorVest Educational Services
- VectorVest OnLine
- VectorVest Options Analyzer
- VectorVest ProGraphics v6.0
- VectorVest ProTrader 7
- VectorVest RealTime Derby Tool
- VectorVest Simulator
- VectorVest Variator
- VectorVest Watchdog
- StockCharts.com, Inc.
- Candle Patterns
- Candlestick Charting Explained
- Intermarket Technical Analysis
- John Murphy on Chart Analysis
- John Murphy's Chart Pattern Recognition
- John Murphy's Market Message
- MurphyExplainsMarketAnalysis-Intermarket Analysis
- MurphyExplainsMarketAnalysis-Visual Analysis
- StockCharts.com
- Technical Analysis of the Financial Markets
- The Visual Investor
