HOT TOPICS LIST
- MACD
- Fibonacci
- RSI
- Gann
- ADXR
- Stochastics
- Volume
- Triangles
- Futures
- Cycles
- Volatility
- ZIGZAG
- MESA
- Retracement
- Aroon
INDICATORS LIST
LIST OF TOPICS
PRINT THIS ARTICLE
by Jayanthi Gopalakrishnan
Applied Materials, Inc. [AMAT] has started showing signs of strength. Is it a buy?
Position: N/A
Jayanthi Gopalakrishnan
PRINT THIS ARTICLE
Applied Materials, Inc. (AMAT) - Poised For A Trend Reversal?
05/25/00 01:42:32 PMby Jayanthi Gopalakrishnan
Applied Materials, Inc. [AMAT] has started showing signs of strength. Is it a buy?
Position: N/A
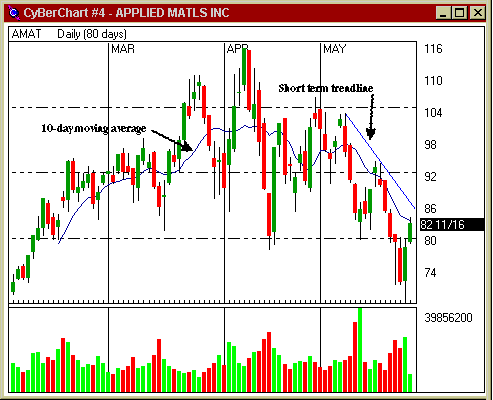
| The chart of AMAT, with the 10-day moving average and a short-term trendline, indicates that the stock may be a strong buy candidate. As of May 25, 2000, the price has approached the 10-day moving average and looks like it may face resistance at that point. However, if prices break above this moving average the critical point would be the short-term trendline- the point of confirmation. |
| If prices break above the trendline with heavy volume I would implement the following trading strategy: Enter long position at $87.00 Exit long position at $91.00 Place a trailing stop loss 1/4 point below price. |

|
| Applied Materials, Inc. [AMAT] is beginning to show signs of a possible trend reversal. |
| Graphic provided by: CyBerCorp, Inc.. |
| |
| If, however, prices met resistance at this trendline and showed signs of reversing I would consider entering a short position. My trading strategy would be: Enter short position at $85.50 Exit short position at $82.50 Place a trailing stop-loss 1/4 point above price. |
| Title: | Editor |
| Company: | Technical Analysis of Stocks & Commodities |
| Address: | 4757 California Ave SW |
| Seattle, WA 98116 | |
| Website: | Traders.com |
| E-mail address: | Jayanthi@traders.com |
Traders' Resource Links | |
| Charting the Stock Market: The Wyckoff Method -- Books | |
| Working-Money.com -- Online Trading Services | |
| Traders.com Advantage -- Online Trading Services | |
| Technical Analysis of Stocks & Commodities -- Publications and Newsletters | |
| Working Money, at Working-Money.com -- Publications and Newsletters | |
| Traders.com Advantage -- Publications and Newsletters | |
| Professional Traders Starter Kit -- Software | |
Click here for more information about our publications!
Comments

Request Information From Our Sponsors
- VectorVest, Inc.
- Executive Premier Workshop
- One-Day Options Course
- OptionsPro
- Retirement Income Workshop
- Sure-Fire Trading Systems (VectorVest, Inc.)
- Trading as a Business Workshop
- VectorVest 7 EOD
- VectorVest 7 RealTime/IntraDay
- VectorVest AutoTester
- VectorVest Educational Services
- VectorVest OnLine
- VectorVest Options Analyzer
- VectorVest ProGraphics v6.0
- VectorVest ProTrader 7
- VectorVest RealTime Derby Tool
- VectorVest Simulator
- VectorVest Variator
- VectorVest Watchdog
- StockCharts.com, Inc.
- Candle Patterns
- Candlestick Charting Explained
- Intermarket Technical Analysis
- John Murphy on Chart Analysis
- John Murphy's Chart Pattern Recognition
- John Murphy's Market Message
- MurphyExplainsMarketAnalysis-Intermarket Analysis
- MurphyExplainsMarketAnalysis-Visual Analysis
- StockCharts.com
- Technical Analysis of the Financial Markets
- The Visual Investor
