

HOT TOPICS LIST
- MACD
- Fibonacci
- RSI
- Gann
- ADXR
- Stochastics
- Volume
- Triangles
- Futures
- Cycles
- Volatility
- ZIGZAG
- MESA
- Retracement
- Aroon
INDICATORS LIST
LIST OF TOPICS
PRINT THIS ARTICLE
by Chris Manuell
IBM continues to develop characteristics that suggest it is attempting to arrest the slide from this past February, and price activity in the coming days could qualify its trend.
Position: N/A
Chris Manuell
Chris Manuell spent 7 years as a futures sales/trader for a large investment bank and more recently as a technical analyst for an independent research company. He has a bachelor of economics and graduate diploma in applied finance & investment. Currently enrolled in the CMT program with the MTA.
PRINT THIS ARTICLE
HEAD & SHOULDERS
IBM: Head & Shoulders, The Sequel
10/04/04 10:27:09 AMby Chris Manuell
IBM continues to develop characteristics that suggest it is attempting to arrest the slide from this past February, and price activity in the coming days could qualify its trend.
Position: N/A
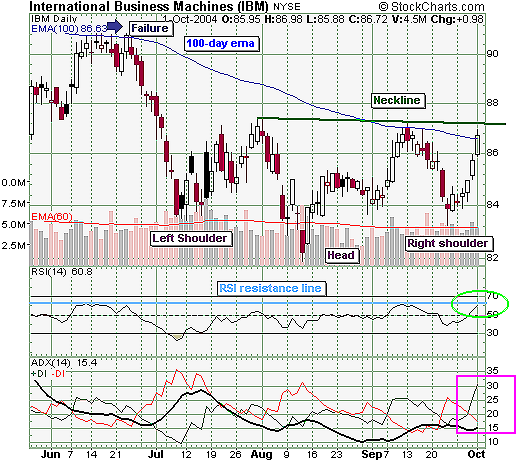
| Last month, I wrote an article on IBM discussing a potential head & shoulders formation in September ("IBM -- Potential Head & Shoulders Bottom," 09/02/04), and although the timing was premature, the formation has continued to unfold. The right shoulder recently developed after a failure to clear the 100-day exponential moving average (EMA) in mid-September. |
| The symmetry of the pattern conforms to the identification requirements, with the shoulders both forming around the 84 region and all components unfolding in roughly a 20-day period. IBM remains at an important juncture, with a confluence of resistance points conspiring to prevent the popular pattern from completing. Popularity and profitability may go hand in hand, with Thomas Bulkowski's ENCYCLOPEDIA OF CHART PATTERNS highlighting some telling statistics from this bullish reversal. The head and shoulders bottom has a low failure rate of 5%, with a confirmed upside breakout delivering an average increment of 38%. |
|
| Figure 1: IBM head & shoulders |
| Graphic provided by: StockCharts.com. |
| |
| Aggressive traders may have already started accumulating positions following the completion of the right shoulder, which was composed of some bullish candlestick reversal patterns. IBM completed a bullish hammer on September 23, which was confirmed the following session when it was enveloped by a strong white candle that completed a bullish engulfing pattern. This provided the impetus for an attack on the integral 100-day EMA and the neckline of the pattern. The 100-day EMA of IBM remained an influential resistance point through the summer, with the market failing in June and then again in September to clear that level. The June attack enabled a close above the 100-day EMA on June 23; however, in the next session the market failed to sustain a move above the average, and a resumption of the downtrend resulted. IBM is currently in a similar position, with a close above the 100-day EMA on October 1. This third phase at breaching the 100-day EMA will determine the likelihood of the head and shoulders pattern being a success. Completion of the pattern would require an upside breakout of the neckline, which is in the 87.20 region. The breakout should occur on high volume, which would "rubber-stamp," or validate, the head and shoulders. |
| The minimum objective of the pattern can be computed by adding the formation height of the pattern to the level where the prices puncture the neckline. The height of the pattern is deduced by subtracting the lowest low from the head from the neckline, measured vertically. The height of this pattern is 5.52. Thus, a break of the neckline in the 87.20 region would present a minimum target of 92.72. RSI may also provide a clue, with the indicator currently pressing against a resistance line that has been a barrier through the summer. A breach of this resistance line would also give bulls confidence in the head and shoulders pattern performing. |
| The average directional movement index (ADX) line is also placed beneath the directional movement index (DMI) lines and with a bullish configuration, +DI above -DI, a move higher by the ADX would result in a strong uptrend materializing. A failure of this pattern to complete would be just as important and would result in a resumption of the downtrend that has dogged the stock this year. |
Chris Manuell spent 7 years as a futures sales/trader for a large investment bank and more recently as a technical analyst for an independent research company. He has a bachelor of economics and graduate diploma in applied finance & investment. Currently enrolled in the CMT program with the MTA.
| E-mail address: | chrismanuell5@yahoo.co.uk |
Click here for more information about our publications!
Comments
Date:�10/06/04Rank:�4Comment:�

Request Information From Our Sponsors
- StockCharts.com, Inc.
- Candle Patterns
- Candlestick Charting Explained
- Intermarket Technical Analysis
- John Murphy on Chart Analysis
- John Murphy's Chart Pattern Recognition
- John Murphy's Market Message
- MurphyExplainsMarketAnalysis-Intermarket Analysis
- MurphyExplainsMarketAnalysis-Visual Analysis
- StockCharts.com
- Technical Analysis of the Financial Markets
- The Visual Investor
- VectorVest, Inc.
- Executive Premier Workshop
- One-Day Options Course
- OptionsPro
- Retirement Income Workshop
- Sure-Fire Trading Systems (VectorVest, Inc.)
- Trading as a Business Workshop
- VectorVest 7 EOD
- VectorVest 7 RealTime/IntraDay
- VectorVest AutoTester
- VectorVest Educational Services
- VectorVest OnLine
- VectorVest Options Analyzer
- VectorVest ProGraphics v6.0
- VectorVest ProTrader 7
- VectorVest RealTime Derby Tool
- VectorVest Simulator
- VectorVest Variator
- VectorVest Watchdog