HOT TOPICS LIST
- MACD
- Fibonacci
- RSI
- Gann
- ADXR
- Stochastics
- Volume
- Triangles
- Futures
- Cycles
- Volatility
- ZIGZAG
- MESA
- Retracement
- Aroon
INDICATORS LIST
LIST OF TOPICS
PRINT THIS ARTICLE
by Kevin Hopson
Target's significant bottom reversal and potentially bullish trading range could point to higher prices ahead.
Position: Hold
Kevin Hopson
Kevin has been a technical analyst for roughly 10 years now. Previously, Kevin owned his own business and acted as a registered investment advisor, specializing in energy. He was also a freelance oil analyst for Orient Trading Co., a commodity futures trading firm in Japan. Kevin is currently a freelance writer.
PRINT THIS ARTICLE
DOUBLE BOTTOMS
Keep Your Eye On The Moving Target
10/04/04 11:00:20 AMby Kevin Hopson
Target's significant bottom reversal and potentially bullish trading range could point to higher prices ahead.
Position: Hold
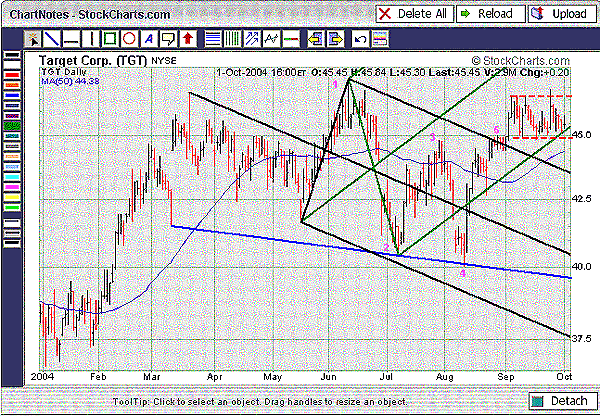
| If you look at a year-to-date chart for Target Corp. (TGT), you might think that the stock has had a hard time deciding which way it wants to go. However, despite the many ups and downs and occasional extreme volatility, Target has seen a bullish pattern develop over the past three months. This pattern is known as a double bottom, or a "W" bottom, to be more exact. This is illustrated by the five pivot points in the chart, which form the letter "W." |
| The left-hand side of the W is formed during the initial downtrend -- from pivot point 1 to pivot point 2. After the initial bottom is put in, prices tend to retrace up to 61.8% of the prior move down. Not coincidentally, Target reversed right at the 61.8% retracement level from the June-July decline, as illustrated by pivot point 3. This completed the first half of the pattern. |

|
| Figure 1: Target Double Bottoms |
| Graphic provided by: StockCharts.com. |
| |
| The second half of the pattern is the most important, however. More specifically, prices have to test the prior low without breaking down, or at least reverse sharply after putting in a slightly lower low. As you can see in the chart, Target slightly exceeded the July low during the second move down. However, note how the stock found support along the blue trendline and reversed with a vengeance the following day. This was a bear trap, meaning that the double bottom formation was still intact. |
| After reversing to the upside, Target continued to move higher. To confirm a bottom reversal, the stock had to exceed the prior (pivot point 3) high. Note how the top parallel line of the black pitchfork converged here, making resistance at this price level even more substantial. Fortunately, Target broke resistance here, confirming a significant bottom reversal in the process. |
| Since then, Target has formed a potentially bullish trading range between the $45.00 and $46.50 levels, as illustrated by the dotted red lines. Trading ranges tend to be continuation patterns. Because the prior move was up, it is likely that Target will break to the upside from this formation. In the meantime, the bottom parallel line of the green pitchfork, the lower channel line (trading range), and the stock's 50-day moving average have all converged in the $44.50 to $45.50 range, which should limit the downside risk in the near term. As a result, I would continue to hold shares of Target Corp. in anticipation of a possible move higher. |
Kevin has been a technical analyst for roughly 10 years now. Previously, Kevin owned his own business and acted as a registered investment advisor, specializing in energy. He was also a freelance oil analyst for Orient Trading Co., a commodity futures trading firm in Japan. Kevin is currently a freelance writer.
| Glen Allen, VA | |
| E-mail address: | hopson_1@yahoo.com |
Click here for more information about our publications!
Comments
Date: 10/06/04Rank: 3Comment:

Request Information From Our Sponsors
- StockCharts.com, Inc.
- Candle Patterns
- Candlestick Charting Explained
- Intermarket Technical Analysis
- John Murphy on Chart Analysis
- John Murphy's Chart Pattern Recognition
- John Murphy's Market Message
- MurphyExplainsMarketAnalysis-Intermarket Analysis
- MurphyExplainsMarketAnalysis-Visual Analysis
- StockCharts.com
- Technical Analysis of the Financial Markets
- The Visual Investor
- VectorVest, Inc.
- Executive Premier Workshop
- One-Day Options Course
- OptionsPro
- Retirement Income Workshop
- Sure-Fire Trading Systems (VectorVest, Inc.)
- Trading as a Business Workshop
- VectorVest 7 EOD
- VectorVest 7 RealTime/IntraDay
- VectorVest AutoTester
- VectorVest Educational Services
- VectorVest OnLine
- VectorVest Options Analyzer
- VectorVest ProGraphics v6.0
- VectorVest ProTrader 7
- VectorVest RealTime Derby Tool
- VectorVest Simulator
- VectorVest Variator
- VectorVest Watchdog
