HOT TOPICS LIST
- MACD
- Fibonacci
- RSI
- Gann
- ADXR
- Stochastics
- Volume
- Triangles
- Futures
- Cycles
- Volatility
- ZIGZAG
- MESA
- Retracement
- Aroon
INDICATORS LIST
LIST OF TOPICS
PRINT THIS ARTICLE
by Gary Grosschadl
This Nasdaq-traded stock may be working on a large double bottom pattern. If so, attractive upside targets may present themselves.
Position: Buy
Gary Grosschadl
Independent Canadian equities trader and technical analyst based in Peterborough
Ontario, Canada.
PRINT THIS ARTICLE
DOUBLE BOTTOMS
RF Micro Devices's Chart Shows An Upleg Developing
09/30/04 10:23:55 AMby Gary Grosschadl
This Nasdaq-traded stock may be working on a large double bottom pattern. If so, attractive upside targets may present themselves.
Position: Buy
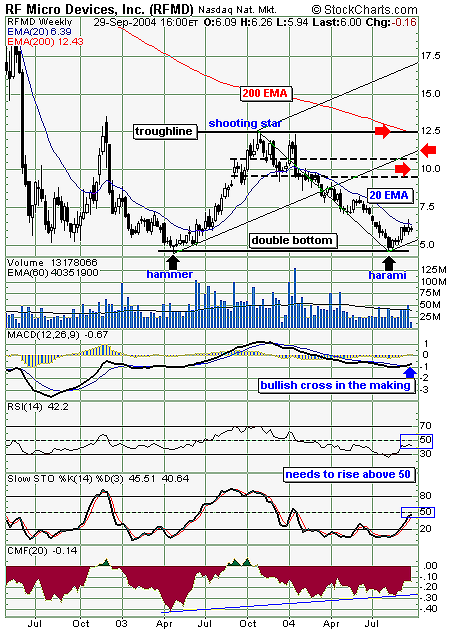
| One of the main features in this chart of RF Micro Devices (RFMD) is the rather large price swings. If this continues to be the case, the next move could follow suit upward. There are several technical reasons to assume a bullish stance, provided the next upside test is passed. As is so often the case, stocks that have taken a significant dive have important upside resistance from their 20-period exponential moving averages (EMAs). I consider stocks under this telling moving average (after a downdraft) to be in failure mode, with only bear rallies before resuming their downtrend. Let's examine some possible reasons why this time may be different, as the stock is consolidating just below this moving average. |
| This could be a double bottom pattern; the symmetry is enticing and it is not much of a stretch to view this as a second double bottom. The initial double bottom had its second bottom at the labeled hammer and the resulting move ended at the shooting star candlestick pattern. This was a huge move from $5 to 12.50. By the book this was a failed double bottom, as it could not make it past the troughline. Traders who played this move to merely test the double pattern made out like the proverbial bandits. The question now: Can this be repeated? |

|
| Figure 1: RF Micro Devices. Here's the weekly chart showing bold upside targets. |
| Graphic provided by: StockCharts.com. |
| |
| Two indicators below Figure 1 show some encouragement to support this notion of a likely move above the 20-period EMA. The moving average/convergence/divergence (MACD) is just starting a bullish cross after a long period of decline. This can lead to a sizable upturn, barring any quick reversal. The Chaikin money flow (CMF) indicator shows a positive divergence to price action. This shows a lessening of bearish selling pressure, another reason that bulls may be able to influence this upleg. The other two indicators reflect the current consolidation below the 20-period exponential moving average (EMA). A sustainable rise above this moving average will have the relative strength index (RSI) and the stochastic rise above their often key 50 levels. |
| Should a bullish thrust prevail above the 20-period EMA, several major upside targets are indicated, one of which will be the likely psychological $10 level, especially since it is contained in a previous area of congestion roughly between 9.50 and 10.50. A green pitchfork (also known as the Andrews line) is shown on the chart, anchored by three significant turning points (the candlestick patterns of hammer, the shooting star, and harami). A mainstay of a relevant pitchfork pattern is a move to the median line (currently 11.25). This presents another upside target. The final target shown is the troughline point of the possible double bottom. Note how the ever-important 200-period EMA is also in that vicinity. As the moving average is moving down, extrapolating forward, it may coincide with the lower targets I have just discussed -- median line and $10. |
| However, first things first. RF Micro Devices must show some strength above its 20-period EMA, which is currently $6.39. In addition, lesser resistance targets could be anticipated at or near $8 and $9, both representing short three-week bear rallies in the past. Traders should beware any early reversal patterns leading up to the more bullish targets mentioned. |
Independent Canadian equities trader and technical analyst based in Peterborough
Ontario, Canada.
| Website: | www.whatsonsale.ca/financial.html |
| E-mail address: | gwg7@sympatico.ca |
Click here for more information about our publications!
Comments
Date: 10/01/04Rank: 3Comment:

Request Information From Our Sponsors
- StockCharts.com, Inc.
- Candle Patterns
- Candlestick Charting Explained
- Intermarket Technical Analysis
- John Murphy on Chart Analysis
- John Murphy's Chart Pattern Recognition
- John Murphy's Market Message
- MurphyExplainsMarketAnalysis-Intermarket Analysis
- MurphyExplainsMarketAnalysis-Visual Analysis
- StockCharts.com
- Technical Analysis of the Financial Markets
- The Visual Investor
- VectorVest, Inc.
- Executive Premier Workshop
- One-Day Options Course
- OptionsPro
- Retirement Income Workshop
- Sure-Fire Trading Systems (VectorVest, Inc.)
- Trading as a Business Workshop
- VectorVest 7 EOD
- VectorVest 7 RealTime/IntraDay
- VectorVest AutoTester
- VectorVest Educational Services
- VectorVest OnLine
- VectorVest Options Analyzer
- VectorVest ProGraphics v6.0
- VectorVest ProTrader 7
- VectorVest RealTime Derby Tool
- VectorVest Simulator
- VectorVest Variator
- VectorVest Watchdog
