HOT TOPICS LIST
- MACD
- Fibonacci
- RSI
- Gann
- ADXR
- Stochastics
- Volume
- Triangles
- Futures
- Cycles
- Volatility
- ZIGZAG
- MESA
- Retracement
- Aroon
INDICATORS LIST
LIST OF TOPICS
PRINT THIS ARTICLE
by Chris Manuell
Terra Nitrogen, which produces and distributes nitrogen fertilizer products, has appreciated 88% since October 2002. But a major candlestick formation has emerged to stall that rally.
Position: N/A
Chris Manuell
Chris Manuell spent 7 years as a futures sales/trader for a large investment bank and more recently as a technical analyst for an independent research company. He has a bachelor of economics and graduate diploma in applied finance & investment. Currently enrolled in the CMT program with the MTA.
PRINT THIS ARTICLE
CANDLESTICK CHARTING
Terra Nitrogen And The Evening Star Formation
09/30/04 08:35:00 AMby Chris Manuell
Terra Nitrogen, which produces and distributes nitrogen fertilizer products, has appreciated 88% since October 2002. But a major candlestick formation has emerged to stall that rally.
Position: N/A
| Terra Nitrogen Corp. (TNH) is involved in an unpretentious field - it produces and distributes nitrogen fertilizer products, which are used by farmers to improve the quality of their crops. TNC has appreciated 88% since October 2002 -- very close to a Fibonacci number (89). However, a major candlestick reversal formation has emerged to stall that rally. |
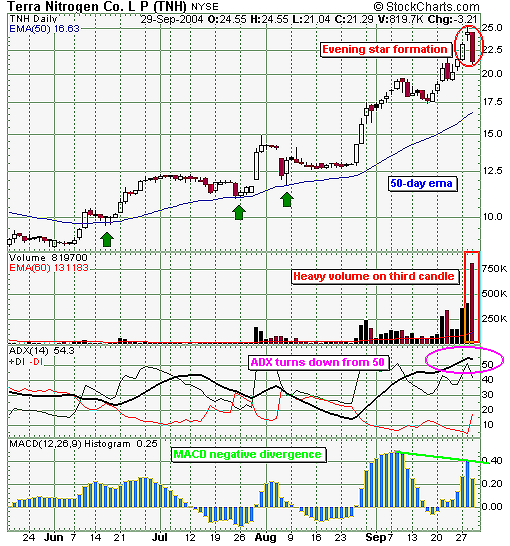
| The evening star formation takes its name from the nickname for the planet Venus, which appropriately emerges before darkness closes in. In a similar fashion, the evening star has also turned out the lights on many rallies. The pattern is composed of three candlesticks. Candle 1 is a long white real body, such as the session on September 27 in TNH. Candle 2 is a star -- a small real body -- that represents a dissipation of buying power. TNH stalled at the 25 level after gapping higher on the open. Candle 3 is a long black real body that closes well into the body of candle 1. TNH achieved this with the September 29th close, which was actually beneath the open of the September 27th session. |

|
| Figure 1: Terra Nitrogen (TNH). The evening star formation has emerged to stall the rally that Terra Nitrogen had been enjoying. |
| Graphic provided by: StockCharts.com. |
| |
| In theory, the evening star should have a gap between the first and second candles and then another gap between the second and third. However, the second gap is rarely achieved and is not mandatory for the completion of this pattern. The key point is that candle 3's body intrudes sharply into the body of candle 1. TNH achieves the gap between the first and second candle, and also the intrusion into candle 1's body. TNH's evening star pattern scores more credibility with the heavy volume session on candle 3, September 29; this qualifies the pattern with an increase in market participants anticipating a reversal. |
| The negative divergence on the moving average convergence/divergence (MACD) histogram also highlights that the recent September swing to new highs was on faltering momentum -- that is, supporting a top formation. The average directional movement index (ADX) also provides a hint that the impressive rally from October 2002 may have lost momentum. The ADX has turned down from above the lofty 50 level, which is usually a good sign that the trend is weakening. |
| A short-term target for TNH could be the 50-day exponential moving average (EMA), which has operated as a good trailing support line this year, as shown on the chart in June, July, and then August. Monitoring the stock's behavior around that zone will provide traders with an insight into the longer-term fortunes of TNH. |
Chris Manuell spent 7 years as a futures sales/trader for a large investment bank and more recently as a technical analyst for an independent research company. He has a bachelor of economics and graduate diploma in applied finance & investment. Currently enrolled in the CMT program with the MTA.
| E-mail address: | chrismanuell5@yahoo.co.uk |
Click here for more information about our publications!
Comments
Date: 10/01/04Rank: 4Comment:

Request Information From Our Sponsors
- VectorVest, Inc.
- Executive Premier Workshop
- One-Day Options Course
- OptionsPro
- Retirement Income Workshop
- Sure-Fire Trading Systems (VectorVest, Inc.)
- Trading as a Business Workshop
- VectorVest 7 EOD
- VectorVest 7 RealTime/IntraDay
- VectorVest AutoTester
- VectorVest Educational Services
- VectorVest OnLine
- VectorVest Options Analyzer
- VectorVest ProGraphics v6.0
- VectorVest ProTrader 7
- VectorVest RealTime Derby Tool
- VectorVest Simulator
- VectorVest Variator
- VectorVest Watchdog
- StockCharts.com, Inc.
- Candle Patterns
- Candlestick Charting Explained
- Intermarket Technical Analysis
- John Murphy on Chart Analysis
- John Murphy's Chart Pattern Recognition
- John Murphy's Market Message
- MurphyExplainsMarketAnalysis-Intermarket Analysis
- MurphyExplainsMarketAnalysis-Visual Analysis
- StockCharts.com
- Technical Analysis of the Financial Markets
- The Visual Investor
