HOT TOPICS LIST
- MACD
- Fibonacci
- RSI
- Gann
- ADXR
- Stochastics
- Volume
- Triangles
- Futures
- Cycles
- Volatility
- ZIGZAG
- MESA
- Retracement
- Aroon
INDICATORS LIST
LIST OF TOPICS
PRINT THIS ARTICLE
by Gary Grosschadl
Biovail's stock has been battered over the past year due to missed financial targets, regulatory investigations, and revelations that its chairman-CEO had sold millions of his Biovail shares.
Position: Accumulate
Gary Grosschadl
Independent Canadian equities trader and technical analyst based in Peterborough
Ontario, Canada.
PRINT THIS ARTICLE
CHART ANALYSIS
Biovail (BVF) Hints At Upleg
09/30/04 10:06:55 AMby Gary Grosschadl
Biovail's stock has been battered over the past year due to missed financial targets, regulatory investigations, and revelations that its chairman-CEO had sold millions of his Biovail shares.
Position: Accumulate
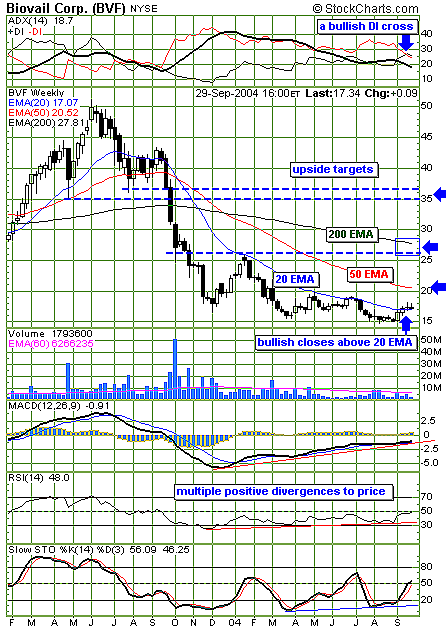
| After the tumult that the Biovail stock (BVF) has suffered, it appears that the bottoming phase is showing some early signs of lifting. This is not readily evident to the pure pattern reader, but traders using moving averages and indicator analysis may have reason to think about accumulating an early position. A "change of character" is hinted at with the 20-week moving average on this weekly chart. As Biovail was making new lows, the stock remained in "failure mode," as witnessed by the bear rallies that were stopped twice by the overhead resistance from the 20-period moving average. Two weeks ago, this changed, and now the stock is working on its third weekly close above this moving average. |
| Several indicators also show bullish developments. The indicator above the chart shows a bearish stance since July 2003. In hindsight, any trader who heeded this indicator could have avoided the precipitous decline from $40 to $15. Now for the first time since the hemorrhaging began, there is a bullish cross of the DI components. In general terms, the bears have control when -DI (representing bearish power) is above +DI (representing bullish power). For continued bullishness, the average directional movement index (ADX) component (trend strength) will have to start upsloping and, ideally, eventually rise above -DI. |

|
| Figure 1: Biovail. Biovail's weekly chart reflects an early "change of character." |
| Graphic provided by: StockCharts.com. |
| |
| The lower indicators all show a pattern of positive divergences to price action. This is often a reliable sign that an upleg will soon develop. Figure 1 shows three upside targets. The 50-period exponential moving average (EMA) is the next significant moving average that I watch. A reversal here or at least a consolidation is always a possibility as some traders decide to take early profits. The next higher target encompasses the ever-significant 200-period EMA and a strategic point of previous reversal, approximately $26. As time progresses, the moving average line may coincide with this $26 level, making it even more significant. Much further along in a bull run, the $35-36 area will likely offer stiff resistance by virtue of previous support signs. |
| On the other hand, a close below the 20-period EMA in the next few weeks would be bearish, and all bullish bets would be off until this resistance is firmly overcome. |
Independent Canadian equities trader and technical analyst based in Peterborough
Ontario, Canada.
| Website: | www.whatsonsale.ca/financial.html |
| E-mail address: | gwg7@sympatico.ca |
Click here for more information about our publications!
Comments
Date: 10/01/04Rank: 4Comment:

Request Information From Our Sponsors
- StockCharts.com, Inc.
- Candle Patterns
- Candlestick Charting Explained
- Intermarket Technical Analysis
- John Murphy on Chart Analysis
- John Murphy's Chart Pattern Recognition
- John Murphy's Market Message
- MurphyExplainsMarketAnalysis-Intermarket Analysis
- MurphyExplainsMarketAnalysis-Visual Analysis
- StockCharts.com
- Technical Analysis of the Financial Markets
- The Visual Investor
- VectorVest, Inc.
- Executive Premier Workshop
- One-Day Options Course
- OptionsPro
- Retirement Income Workshop
- Sure-Fire Trading Systems (VectorVest, Inc.)
- Trading as a Business Workshop
- VectorVest 7 EOD
- VectorVest 7 RealTime/IntraDay
- VectorVest AutoTester
- VectorVest Educational Services
- VectorVest OnLine
- VectorVest Options Analyzer
- VectorVest ProGraphics v6.0
- VectorVest ProTrader 7
- VectorVest RealTime Derby Tool
- VectorVest Simulator
- VectorVest Variator
- VectorVest Watchdog
