HOT TOPICS LIST
- MACD
- Fibonacci
- RSI
- Gann
- ADXR
- Stochastics
- Volume
- Triangles
- Futures
- Cycles
- Volatility
- ZIGZAG
- MESA
- Retracement
- Aroon
INDICATORS LIST
LIST OF TOPICS
PRINT THIS ARTICLE
by Chris Manuell
Wal-Mart completed a powerful candlestick reversal pattern, the hammer, on September 23, 2004, which was reinforced by the fact that it marked a rejection of yearly lows at 51.08 from August 9.
Position: Hold
Chris Manuell
Chris Manuell spent 7 years as a futures sales/trader for a large investment bank and more recently as a technical analyst for an independent research company. He has a bachelor of economics and graduate diploma in applied finance & investment. Currently enrolled in the CMT program with the MTA.
PRINT THIS ARTICLE
DOUBLE BOTTOMS
Hammering Out A Potential Double Bottom With Wal-Mart
09/29/04 09:32:13 AMby Chris Manuell
Wal-Mart completed a powerful candlestick reversal pattern, the hammer, on September 23, 2004, which was reinforced by the fact that it marked a rejection of yearly lows at 51.08 from August 9.
Position: Hold
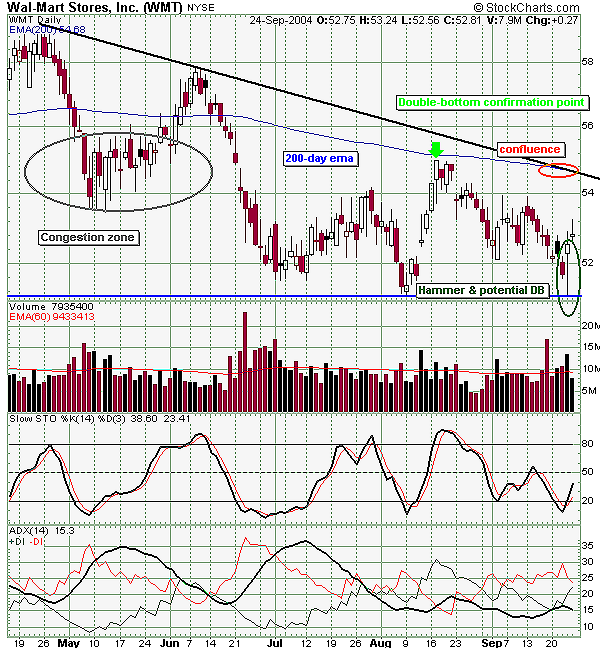
| The defining feature of the hammer formation is the long lower shadow, and the Wal-Mart hammer has this in spades. The market's sharp bounce off the August 9th yearly low at 51.08 is exemplified by the length of the hammer's shadow, which satisfies the requirement of being twice the size of the height of the real body. |
| Volume on the hammer session was also decent -- remaining above the volume 60-day exponential moving average (EMA) -- which suggests that traders may have been testing the yearly low in search of a downside breakout. Bears appeared to lose this battle with the long lower shadow, demonstrating solid demand on the lows. The daily slow stochastics also supported the bounce with a move from oversold through the lower reference lines. |

|
| Figure 1: Wal-Mart Stores |
| Graphic provided by: StockCharts.com. |
| |
| Wal-Mart's hammer has also raised the possibility of a potential double bottom with the bounce from the August 9th low. The confirmation point for the potential double bottom is the highest high between the two troughs -- 54.97 -- which occurred on August 17. Patience is the key to successfully trading these patterns. In ENCYCLOPEDIA OF CHART PATTERNS, Thomas Bulkowski points out that the failure rate of these patterns falls to just 3% if we wait for a confirmation. |
| The confluence of resistance points at the confirmation point also supports a patient approach. The 55 region also equates to the 200-day EMA and short-term bearish trendline from the May highs. The 55 level was also a congestion zone in May, where active distribution appears to have unfolded. Clearance of this zone would provide bulls with confidence that a reversal was in place. A breakout would be confirmed on a close above the confirmation point at 54.97. Taking the height of the pattern and projecting that from the breakout confirmation point then calculates the objective for Wal-Mart. This gives a minimum objective of 58.86. |
| The ADX on Wal-Mart is also worth monitoring, with a potential bullish setup unfolding. The ADX is beneath the pivotal 20 line and the +DMI is threatening to complete a bullish crossover of the -DMI. In summary, the recent Wal-Mart hammer should result in a short-term bounce, with the potential for a more significant reversal to develop on a close above the 54.97 confirmation point of the potential double bottom. |
Chris Manuell spent 7 years as a futures sales/trader for a large investment bank and more recently as a technical analyst for an independent research company. He has a bachelor of economics and graduate diploma in applied finance & investment. Currently enrolled in the CMT program with the MTA.
| E-mail address: | chrismanuell5@yahoo.co.uk |
Click here for more information about our publications!
Comments
Date: 09/29/04Rank: 4Comment:

Request Information From Our Sponsors
- StockCharts.com, Inc.
- Candle Patterns
- Candlestick Charting Explained
- Intermarket Technical Analysis
- John Murphy on Chart Analysis
- John Murphy's Chart Pattern Recognition
- John Murphy's Market Message
- MurphyExplainsMarketAnalysis-Intermarket Analysis
- MurphyExplainsMarketAnalysis-Visual Analysis
- StockCharts.com
- Technical Analysis of the Financial Markets
- The Visual Investor
- VectorVest, Inc.
- Executive Premier Workshop
- One-Day Options Course
- OptionsPro
- Retirement Income Workshop
- Sure-Fire Trading Systems (VectorVest, Inc.)
- Trading as a Business Workshop
- VectorVest 7 EOD
- VectorVest 7 RealTime/IntraDay
- VectorVest AutoTester
- VectorVest Educational Services
- VectorVest OnLine
- VectorVest Options Analyzer
- VectorVest ProGraphics v6.0
- VectorVest ProTrader 7
- VectorVest RealTime Derby Tool
- VectorVest Simulator
- VectorVest Variator
- VectorVest Watchdog
