HOT TOPICS LIST
- MACD
- Fibonacci
- RSI
- Gann
- ADXR
- Stochastics
- Volume
- Triangles
- Futures
- Cycles
- Volatility
- ZIGZAG
- MESA
- Retracement
- Aroon
INDICATORS LIST
LIST OF TOPICS
PRINT THIS ARTICLE
by Gary Grosschadl
After a parabolic rise in share price in 2003 ($3-$15), this mining play (gold and copper) had a severe correction back down to $5. Now it appears to be in play again.
Position: Buy
Gary Grosschadl
Independent Canadian equities trader and technical analyst based in Peterborough
Ontario, Canada.
PRINT THIS ARTICLE
CHART ANALYSIS
Ivanhoe Mines Climbing Higher?
09/28/04 12:07:29 PMby Gary Grosschadl
After a parabolic rise in share price in 2003 ($3-$15), this mining play (gold and copper) had a severe correction back down to $5. Now it appears to be in play again.
Position: Buy
| Ivanhoe Mines is developing a major discovery of gold and copper at the Turquoise Hill project in southern Mongolia, positioned on the doorstep of the world's largest consumer of copper -- China. Ivanhoe shares are listed on Nasdaq under HUGO and on the Toronto and Australian stock exchanges under IVN. |
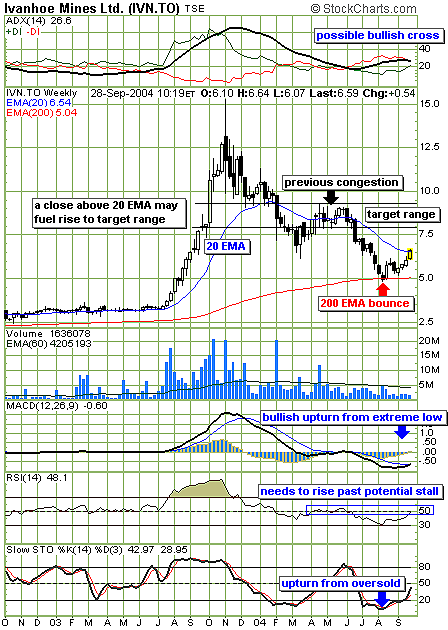
| This weekly chart shows the dramatic rise and fall over the past two years. It appears that the stock may have finally put in a major bottom as it has registered its first higher low and a higher high. Trend changes are validated by a series of higher lows and higher highs, and this will have to continue if a sustained turnaround is under way. |

|
| Figure 1: Ivanhoe Mines two-year weekly chart. |
| Graphic provided by: StockCharts.com. |
| |
| The 200-period moving average is a favored important marker of support and resistance for many market technicians. Over the years, I have found the exponential moving average (EMA) serves me better than the simple moving average in most cases. The EMA is more weighted to recent market action so volatile market action brings about bigger differences between these moving averages. This chart is a good example. The bounce occurred at the 200-period EMA. The 200 MA (not shown) is actually lower at $4.22. |
| The stock has now risen to test its 20-period EMA. After a long decline, this overhead moving average often becomes a make-or-break line for sustainable advances. When a stock refuses to advance beyond this overhead resistance, it often stays in "failure mode" -- that is, the previous decline continues. So the current juncture should be a telling development in a move higher or a resumption of the previous downtrend. I remain bullish for this advance if the weekly close is above $6.54. In that case, the higher target range of $8-9.50 possibly comes into play. This area represents a previous congestion zone as marked on the chart and likely becomes a trading target for aggressive traders. Failure to stay above the 20-period EMA would be a bearish sign. |
Independent Canadian equities trader and technical analyst based in Peterborough
Ontario, Canada.
| Website: | www.whatsonsale.ca/financial.html |
| E-mail address: | gwg7@sympatico.ca |
Click here for more information about our publications!
Comments
Date: 09/29/04Rank: 4Comment:

Request Information From Our Sponsors
- StockCharts.com, Inc.
- Candle Patterns
- Candlestick Charting Explained
- Intermarket Technical Analysis
- John Murphy on Chart Analysis
- John Murphy's Chart Pattern Recognition
- John Murphy's Market Message
- MurphyExplainsMarketAnalysis-Intermarket Analysis
- MurphyExplainsMarketAnalysis-Visual Analysis
- StockCharts.com
- Technical Analysis of the Financial Markets
- The Visual Investor
- VectorVest, Inc.
- Executive Premier Workshop
- One-Day Options Course
- OptionsPro
- Retirement Income Workshop
- Sure-Fire Trading Systems (VectorVest, Inc.)
- Trading as a Business Workshop
- VectorVest 7 EOD
- VectorVest 7 RealTime/IntraDay
- VectorVest AutoTester
- VectorVest Educational Services
- VectorVest OnLine
- VectorVest Options Analyzer
- VectorVest ProGraphics v6.0
- VectorVest ProTrader 7
- VectorVest RealTime Derby Tool
- VectorVest Simulator
- VectorVest Variator
- VectorVest Watchdog
