HOT TOPICS LIST
- MACD
- Fibonacci
- RSI
- Gann
- ADXR
- Stochastics
- Volume
- Triangles
- Futures
- Cycles
- Volatility
- ZIGZAG
- MESA
- Retracement
- Aroon
INDICATORS LIST
LIST OF TOPICS
PRINT THIS ARTICLE
by David Penn
A few thoughts on the perfection of imperfect chart patterns as orange juice futures rally to new highs.
Position: Hold
David Penn
Technical Writer for Technical Analysis of STOCKS & COMMODITIES magazine, Working-Money.com, and Traders.com Advantage.
PRINT THIS ARTICLE
TRIANGLES
Orange Juice's Triangle Triumph
09/28/04 11:29:36 AMby David Penn
A few thoughts on the perfection of imperfect chart patterns as orange juice futures rally to new highs.
Position: Hold
| I'd be curious to know how many readers would have bought my argument for a triangle-based rally in orange juice futures if I'd posted this article on Friday. |
| The fact of the matter is that if you've been much informed about the bull market in orange juice, then odds are you're either a grower or a subscriber to Traders.com Advantage. I've been writing about the bullish potential for orange juice for months -- starting back in July ("Run OJ! Run!", Traders.com Advantage, July 6, 2004). At the time, I warned that the sharp rally in orange juice was likely to be followed by a no-less-sharp correction. However, I did note that such a correction might merely be "a reasonable place for ... orange juice to catch its breath before another run higher." |

|
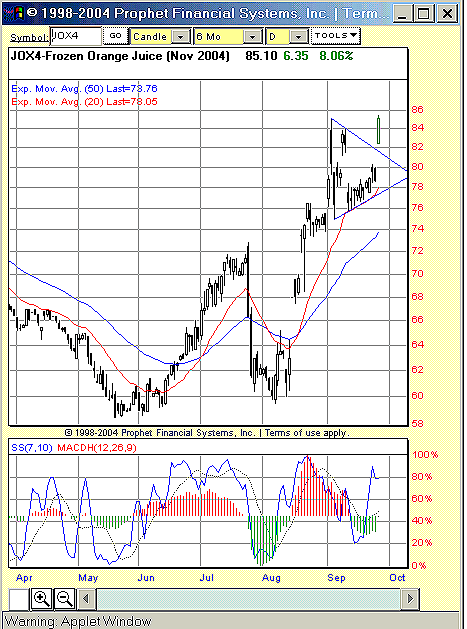
| Figure 1: A gap-filled rally in August and a triangle consolidation in September leads to a breakout days before October begins. |
| Graphic provided by: Prophet Financial Systems, Inc.. |
| |
| The triangle consolidation in September was not a perfect triangle by most measures. While there were consistent touches on the lower trendline boundary of the triangle, the touches on the upper trendline boundary of the triangle were not as numerous, as is the case with most triangle consolidations. |
| Nevertheless, in the wake of the sharp correction in July, it seemed likely that the subsequent correction would be more of the sideways/consolidation variety. This notion of "alternation" is derived from Elliott wave methodology, and it allowed me to anticipate that -- however imperfect the triangle appeared to be -- any September correction would not fall lower than the August highs. So far, this has been the case. If the triangle breakout holds, then orange juice futures should make a run on the 90-cent level. This is based upon a measurement of the triangle at its widest point (approximately 8 cents wide) and adding that number to the value at the breakout point of approximately 82 cents. It is possible that the breakout could reverse, sending prices tumbling back into the body of the triangle pattern. In that event, look for the bottom of the triangle/consolidation to serve as support against further declines. |
| One last note with regard to a wave analysis of the November contract: If the wave 1 rally extended from the May/June lows near 59 to the July highs near 72, and the wave 3 rally extended beyond that level to about 84, then we can anticipate likely areas for a wave 5 top. Based on a projection of wave 1 (wave 1 x 1.618, with the product added to the value at the peak of wave 1), we get a projected wave 5 top at about 93 cents. Assuming a wave 3 top at about 84 cents, we can project (wave 3 x 0.618, with the product added to the value at the peak of wave 3), we get a projected wave 5 top at about 88.5 cents. It is in this range -- from 88.5 to 93 cents, which includes the price target from the triangle breakout -- that orange juice bulls might want to be on guard for weakness, resistance or even reversal. |
Technical Writer for Technical Analysis of STOCKS & COMMODITIES magazine, Working-Money.com, and Traders.com Advantage.
| Title: | Technical Writer |
| Company: | Technical Analysis, Inc. |
| Address: | 4757 California Avenue SW |
| Seattle, WA 98116 | |
| Phone # for sales: | 206 938 0570 |
| Fax: | 206 938 1307 |
| Website: | www.Traders.com |
| E-mail address: | DPenn@traders.com |
Traders' Resource Links | |
| Charting the Stock Market: The Wyckoff Method -- Books | |
| Working-Money.com -- Online Trading Services | |
| Traders.com Advantage -- Online Trading Services | |
| Technical Analysis of Stocks & Commodities -- Publications and Newsletters | |
| Working Money, at Working-Money.com -- Publications and Newsletters | |
| Traders.com Advantage -- Publications and Newsletters | |
| Professional Traders Starter Kit -- Software | |
Click here for more information about our publications!
Comments
Date: 09/28/04Rank: 3Comment:

|

Request Information From Our Sponsors
- StockCharts.com, Inc.
- Candle Patterns
- Candlestick Charting Explained
- Intermarket Technical Analysis
- John Murphy on Chart Analysis
- John Murphy's Chart Pattern Recognition
- John Murphy's Market Message
- MurphyExplainsMarketAnalysis-Intermarket Analysis
- MurphyExplainsMarketAnalysis-Visual Analysis
- StockCharts.com
- Technical Analysis of the Financial Markets
- The Visual Investor
- VectorVest, Inc.
- Executive Premier Workshop
- One-Day Options Course
- OptionsPro
- Retirement Income Workshop
- Sure-Fire Trading Systems (VectorVest, Inc.)
- Trading as a Business Workshop
- VectorVest 7 EOD
- VectorVest 7 RealTime/IntraDay
- VectorVest AutoTester
- VectorVest Educational Services
- VectorVest OnLine
- VectorVest Options Analyzer
- VectorVest ProGraphics v6.0
- VectorVest ProTrader 7
- VectorVest RealTime Derby Tool
- VectorVest Simulator
- VectorVest Variator
- VectorVest Watchdog
