HOT TOPICS LIST
- MACD
- Fibonacci
- RSI
- Gann
- ADXR
- Stochastics
- Volume
- Triangles
- Futures
- Cycles
- Volatility
- ZIGZAG
- MESA
- Retracement
- Aroon
INDICATORS LIST
LIST OF TOPICS
PRINT THIS ARTICLE
by Gary Grosschadl
With oil markets heating up again the past several weeks, many traders are looking at oil stocks.
Position: Hold
Gary Grosschadl
Independent Canadian equities trader and technical analyst based in Peterborough
Ontario, Canada.
PRINT THIS ARTICLE
CHART ANALYSIS
Thunder Energy Long-Term View
09/29/04 10:24:57 AMby Gary Grosschadl
With oil markets heating up again the past several weeks, many traders are looking at oil stocks.
Position: Hold
| Recently, a trader asked me about the longer-term chart prospects of this junior Canadian prospect -- Thunder Energy, trading on the TSX (Toronto Stock Exchange). The daily chart is showing some recent bullishness, which is no surprise, but what of the long-term picture? |
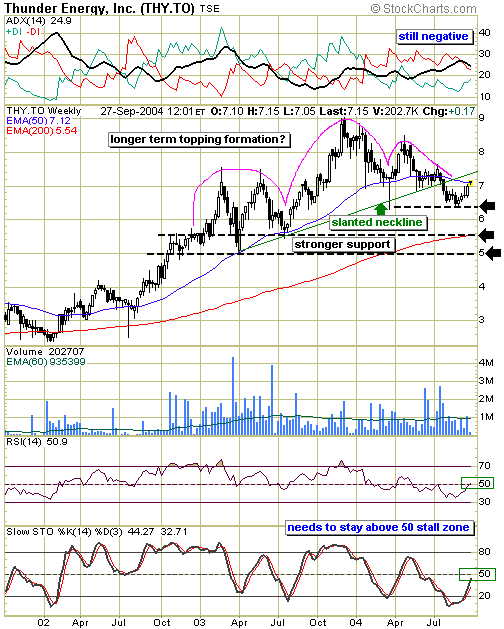
| This weekly chart shows THY in a longer-term uptrend being above its 200-period exponential moving average (EMA). However, some warning signs are appearing. Note the good support of the 50-period EMA during this uptrend. This was recently violated, and it is being tested again. A look at some pattern recognition suggests a possible topping formation in the form of a complex head & shoulders pattern (complex because of its multiple shoulders). Where to draw the slanted neckline is somewhat subjective, one possible interpretation shown on the chart. If you draw another trendline connecting the major "tail" lows, you can also conclude that a three-year trendline has been broken to the downside. |

|
| Figure 1: Thunder Energy. The weekly chart hints at possible weakness ahead. |
| Graphic provided by: StockCharts.com. |
| |
| Failure at either the 50-period EMA or the higher slanted neckline may bring a lower test of stronger support near the 200-period EMA, currently 5.54 or the $5 mark. However, the first line of support is the previous low of approximately $6.40. A move under this line could be another warning bell. |
| Several other indicators can be considered. The upper indicator shows the directional movement indicator (DMI). The average directional movement index (ADX) or trend strength component shows the current bear trend is getting weaker, but until the DIs actually cross, the jury is still out whether the bulls can take charge. The lower indicators -- relative strength and stochastics -- both show a move to their respective 50 levels. This is often a key area for these indicators and can act as a stall point. A move above this level is bullish but a stall is bearish. |
| Whether this turns out to be a topping formation remains to be seen. My line in the sand is shown at the $6.40 level. A violation here can bring those lower tests at $5.50 and $5. Should the stock continue higher, above the slanted neckline (approximately $7.40), then the bulls resume control for another attempt to challenge the top of the right shoulder. |
Independent Canadian equities trader and technical analyst based in Peterborough
Ontario, Canada.
| Website: | www.whatsonsale.ca/financial.html |
| E-mail address: | gwg7@sympatico.ca |
Click here for more information about our publications!
Comments
Date: 10/01/04Rank: Comment: Why do all chartists use sma 65 or in your case ema 60 on vol. can we use lower vol days like a 10 or 20?
in case of newly listed securities what would you use?
pls reply
sekhar krishnan
Date: 10/01/04Rank: Comment: Why do all chartists use sma 65 or in your case ema 60 on vol. can we use lower vol days like a 10 or 20?
in case of newly listed securities what would you use?
pls reply
sekhar krishnan
esskay6268@yahoo.com
Date: 10/01/04Rank: 4Comment:

Request Information From Our Sponsors
- StockCharts.com, Inc.
- Candle Patterns
- Candlestick Charting Explained
- Intermarket Technical Analysis
- John Murphy on Chart Analysis
- John Murphy's Chart Pattern Recognition
- John Murphy's Market Message
- MurphyExplainsMarketAnalysis-Intermarket Analysis
- MurphyExplainsMarketAnalysis-Visual Analysis
- StockCharts.com
- Technical Analysis of the Financial Markets
- The Visual Investor
- VectorVest, Inc.
- Executive Premier Workshop
- One-Day Options Course
- OptionsPro
- Retirement Income Workshop
- Sure-Fire Trading Systems (VectorVest, Inc.)
- Trading as a Business Workshop
- VectorVest 7 EOD
- VectorVest 7 RealTime/IntraDay
- VectorVest AutoTester
- VectorVest Educational Services
- VectorVest OnLine
- VectorVest Options Analyzer
- VectorVest ProGraphics v6.0
- VectorVest ProTrader 7
- VectorVest RealTime Derby Tool
- VectorVest Simulator
- VectorVest Variator
- VectorVest Watchdog
