HOT TOPICS LIST
- MACD
- Fibonacci
- RSI
- Gann
- ADXR
- Stochastics
- Volume
- Triangles
- Futures
- Cycles
- Volatility
- ZIGZAG
- MESA
- Retracement
- Aroon
INDICATORS LIST
LIST OF TOPICS
PRINT THIS ARTICLE
by Kevin Hopson
Is Honeywell ready to resume its long-term uptrend or will the short-term bears sink the stock price?
Position: Hold
Kevin Hopson
Kevin has been a technical analyst for roughly 10 years now. Previously, Kevin owned his own business and acted as a registered investment advisor, specializing in energy. He was also a freelance oil analyst for Orient Trading Co., a commodity futures trading firm in Japan. Kevin is currently a freelance writer.
PRINT THIS ARTICLE
TECHNICAL ANALYSIS
Is Honeywell International Ready to Break Down?
09/28/04 09:40:51 AMby Kevin Hopson
Is Honeywell ready to resume its long-term uptrend or will the short-term bears sink the stock price?
Position: Hold
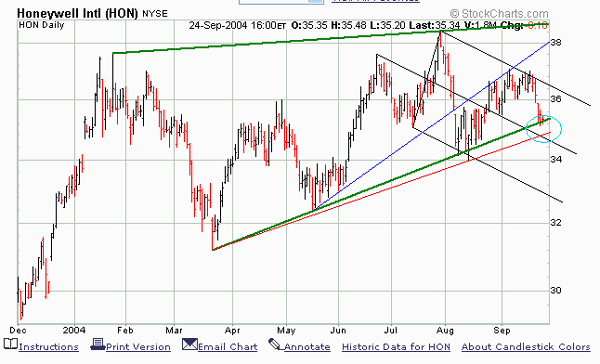
| Honeywell International (HON), contrary to the major indexes, has seen a steady move higher the last several months. However, the stock is at a crossroads right now, meaning that a resumption of the long-term uptrend will have to resume soon or Honeywell will likely see a reversal to the downside. For example, note how the stock has formed a large rising wedge over the past eight months, as illustrated by the green trendlines. Rising wedges tend to break in the opposite direction of the triangle, making them potentially bearish patterns. |
| As you can see, Honeywell is hugging the bottom of the rising wedge formation right now (March's uptrend line). Coming into play right below this level is the uptrend line (red line), connecting the March and August lows. In addition, the median line of the black pitchfork is converging here. As a result, a breach of support around the $34.80 level would likely indicate a breakdown from the rising wedge formation. |

|
| Graphic provided by: Stockcharts.com. |
| |
| Though the path of least resistance in the long term is still up, the short-term picture is different. More specifically, note how Honeywell breached May's uptrend line (blue line) in early August. This trendline is also known as a multipivot gap line. In other words, the stock price tested this uptrend line several times before gapping below it in August. When this occurs, prices tend to find resistance along the multipivot gap line. As you can see, Honeywell found resistance here during its late August and early September rally. |
| Since then, the stock has been stuck in the falling pitchfork configuration, with the top parallel line acting as resistance. Until Honeywell can break above the top parallel line (or July's downtrend line), there will be pressure on the stock to test the bottom of the rising wedge formation. In case you do not know, the more prices test a certain support/resistance level, the less likely this level will hold. |
| However, because Honeywell remains above long-term support and has the potential to move higher within the rising wedge formation before eventually breaking down, I would continue to hold shares of the stock. In the meantime, look for a breach of support in the light blue circle as an indication to take profits and/or go short the stock. |
Kevin has been a technical analyst for roughly 10 years now. Previously, Kevin owned his own business and acted as a registered investment advisor, specializing in energy. He was also a freelance oil analyst for Orient Trading Co., a commodity futures trading firm in Japan. Kevin is currently a freelance writer.
| Glen Allen, VA | |
| E-mail address: | hopson_1@yahoo.com |
Click here for more information about our publications!
Comments
Date: 09/28/04Rank: 5Comment:

|

Request Information From Our Sponsors
- StockCharts.com, Inc.
- Candle Patterns
- Candlestick Charting Explained
- Intermarket Technical Analysis
- John Murphy on Chart Analysis
- John Murphy's Chart Pattern Recognition
- John Murphy's Market Message
- MurphyExplainsMarketAnalysis-Intermarket Analysis
- MurphyExplainsMarketAnalysis-Visual Analysis
- StockCharts.com
- Technical Analysis of the Financial Markets
- The Visual Investor
- VectorVest, Inc.
- Executive Premier Workshop
- One-Day Options Course
- OptionsPro
- Retirement Income Workshop
- Sure-Fire Trading Systems (VectorVest, Inc.)
- Trading as a Business Workshop
- VectorVest 7 EOD
- VectorVest 7 RealTime/IntraDay
- VectorVest AutoTester
- VectorVest Educational Services
- VectorVest OnLine
- VectorVest Options Analyzer
- VectorVest ProGraphics v6.0
- VectorVest ProTrader 7
- VectorVest RealTime Derby Tool
- VectorVest Simulator
- VectorVest Variator
- VectorVest Watchdog
