HOT TOPICS LIST
- MACD
- Fibonacci
- RSI
- Gann
- ADXR
- Stochastics
- Volume
- Triangles
- Futures
- Cycles
- Volatility
- ZIGZAG
- MESA
- Retracement
- Aroon
INDICATORS LIST
LIST OF TOPICS
PRINT THIS ARTICLE
by Han Kim
Understanding retracements could save you the agony of closing out your positions too early. How often have you sold a stock only to see the prices bounce right back up? You have just been shaken out of the market.
Position: N/A
Han Kim
Traders.com Advantage Staff Writer
PRINT THIS ARTICLE
RETRACEMENT
Your Winnings And Retracement
05/23/00 12:40:07 PMby Han Kim
Understanding retracements could save you the agony of closing out your positions too early. How often have you sold a stock only to see the prices bounce right back up? You have just been shaken out of the market.
Position: N/A
| There are three key levels of retracements located at the 33%, 50%, and 66% levels. It is very common for a trending security to retrace down to 33% before continuing to trend again. The maximum retracement was determined to be 66%, with anything greater suggesting a trend reversal. Although there are many retracement levels between the 33% and 66% range, the 50% retracement is considered the most common. Although retracements don't always fall exactly on these percentages, they are good guides for determining price movement. By using these retracement values you can determine if you are at the point where the retracment might turn and begin to trend again. |
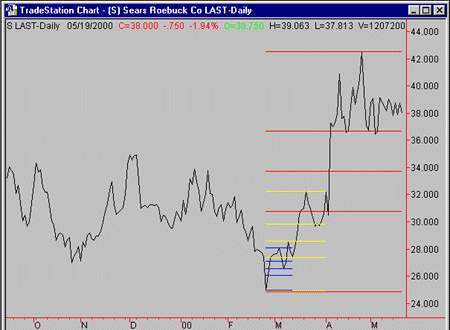
| As an example of retracement values, Sears Roebuck Co. (S), shown below, has been in an uptrend since late February, 2000. There were times that the trend looked like it had reversed- or was it just a retracement? Following a general rule of thumb, a retracement greater than 66% is considered a trend reversal. The first pullback (since late February), occurred in early March, shown on the chart as the blue retracement lines. Here, the price went below 33% to the 50% line at which point it started trending again. |

|
| The daily close of Sears Roebuck Co. (S) with three sets of 33%, 50%, and 66% retracement lines, shown in blue, yellow, and red lines. |
| Graphic provided by: TradeStation. |
| |
| The second pullback happened in late March (yellow lines). Here, the price bounced around the 33% line a few times before trending again. A similar scenario can be seen again in late April where, after reaching a high, prices retraced down to the 33% line. |
| These retracement levels can be used for entry/exit points for your trading. If you opened a long position at the beginning of a trend, you would hold it as long as the trend was in your favor, while keeping an eye on the activity at the retracement levels. If you are a short term trader, you may prefer to exit your position when prices fall below the first retracement level. |
Traders.com Advantage Staff Writer
| Title: | Webmaster |
| Company: | Technical Analysis, Inc. |
| Address: | 4757 California AVE SW |
| Seattle, WA 98116 | |
| Phone # for sales: | 206-938-0570 |
| Fax: | 206-938-1307 |
| Website: | www.traders.com |
| E-mail address: | hkim@traders.com |
Traders' Resource Links | |
| Charting the Stock Market: The Wyckoff Method -- Books | |
| Working-Money.com -- Online Trading Services | |
| Traders.com Advantage -- Online Trading Services | |
| Technical Analysis of Stocks & Commodities -- Publications and Newsletters | |
| Working Money, at Working-Money.com -- Publications and Newsletters | |
| Traders.com Advantage -- Publications and Newsletters | |
| Professional Traders Starter Kit -- Software | |
Click here for more information about our publications!
Comments
Date: / /Rank: 4Comment:
Date: / /Rank: 4Comment: Is there any way your can project
upcoming target ( you enter long
at trend begining) use retracement?
like 133% 167%
thanks

|

Request Information From Our Sponsors
- StockCharts.com, Inc.
- Candle Patterns
- Candlestick Charting Explained
- Intermarket Technical Analysis
- John Murphy on Chart Analysis
- John Murphy's Chart Pattern Recognition
- John Murphy's Market Message
- MurphyExplainsMarketAnalysis-Intermarket Analysis
- MurphyExplainsMarketAnalysis-Visual Analysis
- StockCharts.com
- Technical Analysis of the Financial Markets
- The Visual Investor
- VectorVest, Inc.
- Executive Premier Workshop
- One-Day Options Course
- OptionsPro
- Retirement Income Workshop
- Sure-Fire Trading Systems (VectorVest, Inc.)
- Trading as a Business Workshop
- VectorVest 7 EOD
- VectorVest 7 RealTime/IntraDay
- VectorVest AutoTester
- VectorVest Educational Services
- VectorVest OnLine
- VectorVest Options Analyzer
- VectorVest ProGraphics v6.0
- VectorVest ProTrader 7
- VectorVest RealTime Derby Tool
- VectorVest Simulator
- VectorVest Variator
- VectorVest Watchdog
