HOT TOPICS LIST
- MACD
- Fibonacci
- RSI
- Gann
- ADXR
- Stochastics
- Volume
- Triangles
- Futures
- Cycles
- Volatility
- ZIGZAG
- MESA
- Retracement
- Aroon
INDICATORS LIST
LIST OF TOPICS
PRINT THIS ARTICLE
by Koos van der Merwe
One small company is profiting from the war in Iraq.
Position: Accumulate
Koos van der Merwe
Has been a technical analyst since 1969, and has worked as a futures and options trader with First Financial Futures in Johannesburg, South Africa.
PRINT THIS ARTICLE
MOVING AVERAGES
Ceramic Protection Corp. Is Profiting
09/27/04 03:49:43 PMby Koos van der Merwe
One small company is profiting from the war in Iraq.
Position: Accumulate
| The Ceramic Protection Corp. manufactures and markets custom structural ceramic products and ballistic protection systems. They focus on providing solutions for customers in abrasion resistance, corrosive environments, impact resistance, thermal shock and ballistic protection applications. In other words, one of the products they manufacture are bullet proof vests. |
| The Vancouver Stock Exchange has the reputation of being a venture capital exchange -- that is, where companies list to receive monies that they use to develop a product. Mines drill holes of hope; biotechnology companies research test tubes of hopeful cures. Manufacturing companies develop and manufacture a new idea and hope there is a market for its product. Few companies succeed, but when they do, the profits they make pay investors who take the risk handsomely, and make up for all the struggling years of losses. Ceramic Protection is one of those successful companies. |

|
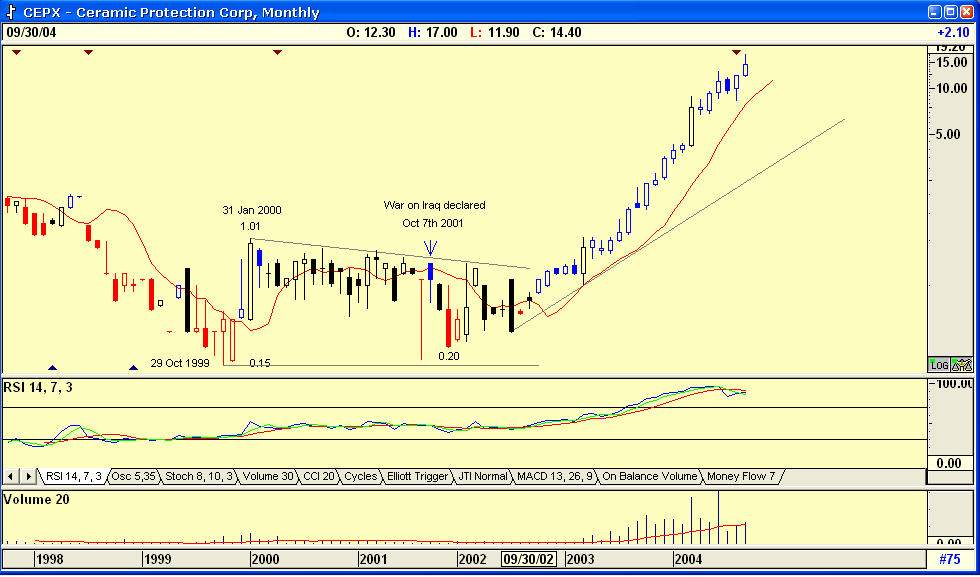
| Figure 1: Ceramic Protection Corp. monthly chart. |
| Graphic provided by: AdvancedGET. |
| |
| The first chart is a monthly semi-logarithmic chart. It shows the price of the company' s shares on October 29, 1999, was $0.15, falling from highs of $2.91 in the years when the stock market was bubbling. Those speculators, and of course owners who believed in the company, saw the price jump to $1.01 in January 2000 but watched their hopes dashed as the bubble burst, and the share price fell with the market, taking a nasty hit by falling to $0.20 with the declaration of war against Iraq. This would have demoralized any investor, but volume was below average. From this low, almost overnight, events started coming right for the company. They received huge orders for their products from the US military, and the share price soared to a high of $17.49. The hopes of investors were paid off handsomely. |
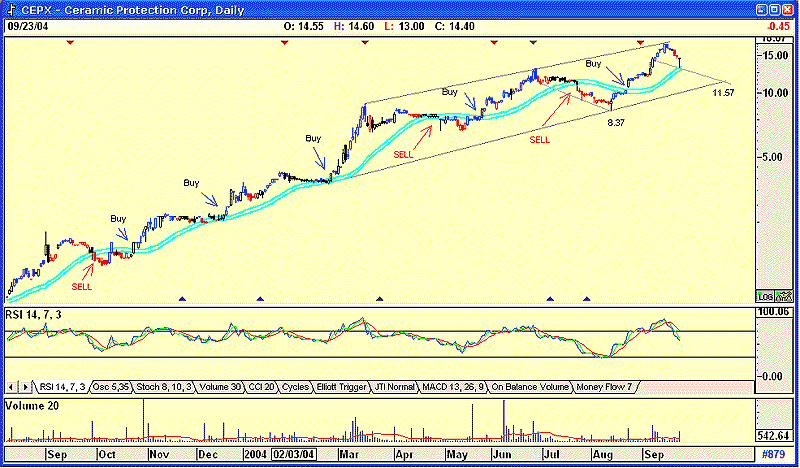
| What now? Here I look to a daily chart. I have used a JM internal band (blue lines) to highlight buy and sell levels. The JM internal band on this chart is a 15-period simple moving average offset by 2% and -2%. The price has fallen back to the lower JM band, but has not penetrated it to give a sell signal. The RSI indicator is suggesting that the price could move down to test the lower trend line possibly at 11.57, but this figure is pure guesswork, and depends at what time period the price will touch the trendline. |
 Figure 2: Daily chart of the Ceramic Protection Corporation. I would wait for prices to pull back to this trendline before opening a long position. |
Has been a technical analyst since 1969, and has worked as a futures and options trader with First Financial Futures in Johannesburg, South Africa.
| Address: | 3256 West 24th Ave |
| Vancouver, BC | |
| Phone # for sales: | 6042634214 |
| E-mail address: | petroosp@gmail.com |
Click here for more information about our publications!
Comments
Date: 09/27/04Rank: 3Comment:

Request Information From Our Sponsors
- StockCharts.com, Inc.
- Candle Patterns
- Candlestick Charting Explained
- Intermarket Technical Analysis
- John Murphy on Chart Analysis
- John Murphy's Chart Pattern Recognition
- John Murphy's Market Message
- MurphyExplainsMarketAnalysis-Intermarket Analysis
- MurphyExplainsMarketAnalysis-Visual Analysis
- StockCharts.com
- Technical Analysis of the Financial Markets
- The Visual Investor
- VectorVest, Inc.
- Executive Premier Workshop
- One-Day Options Course
- OptionsPro
- Retirement Income Workshop
- Sure-Fire Trading Systems (VectorVest, Inc.)
- Trading as a Business Workshop
- VectorVest 7 EOD
- VectorVest 7 RealTime/IntraDay
- VectorVest AutoTester
- VectorVest Educational Services
- VectorVest OnLine
- VectorVest Options Analyzer
- VectorVest ProGraphics v6.0
- VectorVest ProTrader 7
- VectorVest RealTime Derby Tool
- VectorVest Simulator
- VectorVest Variator
- VectorVest Watchdog
