

HOT TOPICS LIST
- MACD
- Fibonacci
- RSI
- Gann
- ADXR
- Stochastics
- Volume
- Triangles
- Futures
- Cycles
- Volatility
- ZIGZAG
- MESA
- Retracement
- Aroon
INDICATORS LIST
LIST OF TOPICS
PRINT THIS ARTICLE
by Chris Manuell
Gold is a widely followed and important commodity in the financial market jigsaw puzzle. While a popular trading vehicle in its own right, it also has a strong inverse relationship with the US dollar. Unravelling the direction of gold can provide traders with an insight into the behaviour of other assets and is integral in any intermarket analysis.
Position: N/A
Chris Manuell
Chris Manuell spent 7 years as a futures sales/trader for a large investment bank and more recently as a technical analyst for an independent research company. He has a bachelor of economics and graduate diploma in applied finance & investment. Currently enrolled in the CMT program with the MTA.
PRINT THIS ARTICLE
ASCENDING TRIANGLES
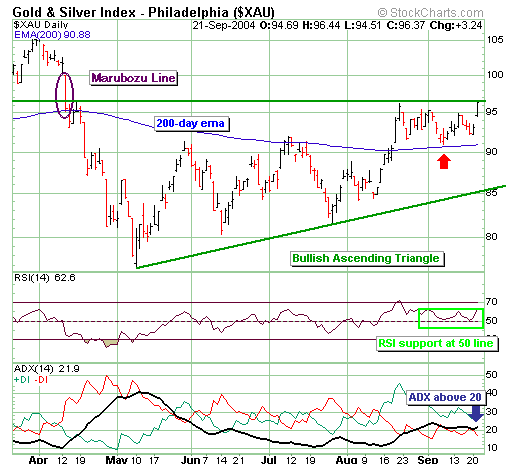
Gold & Silver Index -Ascending Triangle
09/23/04 09:13:09 AMby Chris Manuell
Gold is a widely followed and important commodity in the financial market jigsaw puzzle. While a popular trading vehicle in its own right, it also has a strong inverse relationship with the US dollar. Unravelling the direction of gold can provide traders with an insight into the behaviour of other assets and is integral in any intermarket analysis.
Position: N/A
| The Gold and Silver index is at an important juncture as a bullish ascending triangle appears to be unfolding. The minimum requirements for a triange have been satisfied with a horizontal top line and upsloping bottom trendline present - with at least two touches on both trendlines. The ADX supports the triangle formation, as it has remained in a downtrend since peaking in early May. A falling ADX identifies a listless market and supports the "coil" idiom often used with triangles. |
|
| Graphic provided by: Stockcharts.com. |
| |
| The market has positioned itself for an attack on the upper horizontal line with a successful rejection of the 200-day EMA in early September, which often provides a launching pad after a market corrects. The RSI also identified a reluctance of the index to move lower with a "double-bottom" type formation on the center line at 50. |
| A break of the ascending triangle's upper trendline would complete the pattern and the index should move sharply higher from the breakout point. The ADX has recently pierced the 20 level, which suggests a trending move may be imminent. |
| Bullish ascending triangles are historically susceptible to premature breakouts. A premature breakout could be avoided by waiting for a close above the marubozu line from April 13 marked on the chart. A marubozu is the body of the candlestick formation - the difference of the open and close of a session. The Gold and Silver Index completed a black marubozu on April 13 - opening on its high and trading lower to close on or near its low. The marubozu line is the midpoint of the body of the marubozu. This is a 50% line between the open and the close. This retracement point often acts as a potential support or resistance line. The marubozu line from April 13 is 97.77 - which is the midpoint of the opening and closing levels from that session. Thus, waiting for a close above 97.77 would provide confirmation of the bullish ascending triangle. A prudent trader would benefit if they waited to confirm the upside breakout. Thomas Bulkowski in Encyclopedia of Chart Patterns found the failure rate of an ascending triangle to be a mere 2%, with an upside breakout. He also suggests that successful ascending triangles show an average rise of 44%. |
Chris Manuell spent 7 years as a futures sales/trader for a large investment bank and more recently as a technical analyst for an independent research company. He has a bachelor of economics and graduate diploma in applied finance & investment. Currently enrolled in the CMT program with the MTA.
| E-mail address: | chrismanuell5@yahoo.co.uk |
Click here for more information about our publications!
Comments
Date:�09/24/04Rank:�5Comment:�
Date:�09/24/04Rank:�5Comment:�
Date:�09/24/04Rank:�5Comment:�
Date:�09/26/04Rank:�4Comment:�well done. Unfortunately intermarkets relations correlations do not work so precisely anymore...

Request Information From Our Sponsors
- StockCharts.com, Inc.
- Candle Patterns
- Candlestick Charting Explained
- Intermarket Technical Analysis
- John Murphy on Chart Analysis
- John Murphy's Chart Pattern Recognition
- John Murphy's Market Message
- MurphyExplainsMarketAnalysis-Intermarket Analysis
- MurphyExplainsMarketAnalysis-Visual Analysis
- StockCharts.com
- Technical Analysis of the Financial Markets
- The Visual Investor
- VectorVest, Inc.
- Executive Premier Workshop
- One-Day Options Course
- OptionsPro
- Retirement Income Workshop
- Sure-Fire Trading Systems (VectorVest, Inc.)
- Trading as a Business Workshop
- VectorVest 7 EOD
- VectorVest 7 RealTime/IntraDay
- VectorVest AutoTester
- VectorVest Educational Services
- VectorVest OnLine
- VectorVest Options Analyzer
- VectorVest ProGraphics v6.0
- VectorVest ProTrader 7
- VectorVest RealTime Derby Tool
- VectorVest Simulator
- VectorVest Variator
- VectorVest Watchdog