HOT TOPICS LIST
- MACD
- Fibonacci
- RSI
- Gann
- ADXR
- Stochastics
- Volume
- Triangles
- Futures
- Cycles
- Volatility
- ZIGZAG
- MESA
- Retracement
- Aroon
INDICATORS LIST
LIST OF TOPICS
PRINT THIS ARTICLE
by David Penn
Follow-through to the downside in this leading semiconductor stock could mean an especially bearish October for Intel.
Position: N/A
David Penn
Technical Writer for Technical Analysis of STOCKS & COMMODITIES magazine, Working-Money.com, and Traders.com Advantage.
PRINT THIS ARTICLE
REVERSAL
Is Intel Setting Up For Another Leg Down?
09/23/04 12:15:40 PMby David Penn
Follow-through to the downside in this leading semiconductor stock could mean an especially bearish October for Intel.
Position: N/A
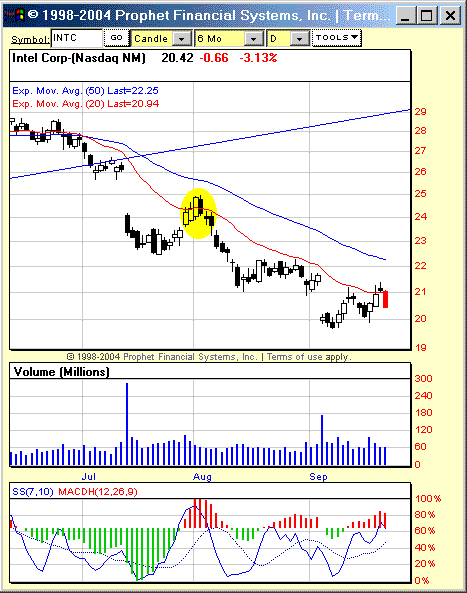
| The last time shares of Intel (INTC) close above their 20-day exponential moving average on one day, then closed beneath their 20-day exponential moving average the next day, Intel subsequently lost more than 16% of its value in about 23 trading days (or, roughly, one trading month). Why might that be relevant? |
| Because on Tuesday, September 21st Intel closed above its 20-day EMA and today -- Wednesday, September 22nd -- Intel closed below that same exponential moving average. |

|
| Could the move below the 20-day EMA in September be signaling the same sort of continued correction that the move below the 20-day EMA did in early August? |
| Graphic provided by: Prophet Financial Systems, Inc. |
| |
| Volume as Intel closed beneath the 20-day EMA was not overwhelming. But it wasn't overwhelming when Intel broke down in early August, either. In fact, Intel continued to trend down on average volume until it finally fell to the $20 level, when a spike in volume helped signal the end of the trend -- however temporary that end may turn out to be. |
| One problem about this bottom -- a problem that might underscore its temporariness -- is that it did not occur with a stochastic positive divergence. Bottoms can form in the absence of positive divergences in stochastics and other oscillators. But taking Intel in context, it is important to consider not only the downtrend that has characterized Intel's performance in recent months, but also the resistance currently provided by the 20-day EMA. |
| Not shown here is the SMH or semiconductors HOLDRS, which has a chart that looks strikingly like Intel's. One difference is that SMH has met with resistance at its 50-day -- as opposed to its 20-day -- exponential moving average. While this might be relatively (and arguably) more bullish, another feature that SMH has that Intel does not is a negative stochastic divergence between its higher price peaks of September 14 and September 21, and its lower stochastic peaks of the same dates. Any significant follow-through to the downside in Intel will likely be a green light for those looking for opportunities on the short side. In particular, $20.10 is the level I will be most closely watching for evidence of downside follow-through. |
Technical Writer for Technical Analysis of STOCKS & COMMODITIES magazine, Working-Money.com, and Traders.com Advantage.
| Title: | Technical Writer |
| Company: | Technical Analysis, Inc. |
| Address: | 4757 California Avenue SW |
| Seattle, WA 98116 | |
| Phone # for sales: | 206 938 0570 |
| Fax: | 206 938 1307 |
| Website: | www.Traders.com |
| E-mail address: | DPenn@traders.com |
Traders' Resource Links | |
| Charting the Stock Market: The Wyckoff Method -- Books | |
| Working-Money.com -- Online Trading Services | |
| Traders.com Advantage -- Online Trading Services | |
| Technical Analysis of Stocks & Commodities -- Publications and Newsletters | |
| Working Money, at Working-Money.com -- Publications and Newsletters | |
| Traders.com Advantage -- Publications and Newsletters | |
| Professional Traders Starter Kit -- Software | |
Click here for more information about our publications!
Comments
Date: 09/24/04Rank: 4Comment:

|

Request Information From Our Sponsors
- StockCharts.com, Inc.
- Candle Patterns
- Candlestick Charting Explained
- Intermarket Technical Analysis
- John Murphy on Chart Analysis
- John Murphy's Chart Pattern Recognition
- John Murphy's Market Message
- MurphyExplainsMarketAnalysis-Intermarket Analysis
- MurphyExplainsMarketAnalysis-Visual Analysis
- StockCharts.com
- Technical Analysis of the Financial Markets
- The Visual Investor
- VectorVest, Inc.
- Executive Premier Workshop
- One-Day Options Course
- OptionsPro
- Retirement Income Workshop
- Sure-Fire Trading Systems (VectorVest, Inc.)
- Trading as a Business Workshop
- VectorVest 7 EOD
- VectorVest 7 RealTime/IntraDay
- VectorVest AutoTester
- VectorVest Educational Services
- VectorVest OnLine
- VectorVest Options Analyzer
- VectorVest ProGraphics v6.0
- VectorVest ProTrader 7
- VectorVest RealTime Derby Tool
- VectorVest Simulator
- VectorVest Variator
- VectorVest Watchdog
