HOT TOPICS LIST
- MACD
- Fibonacci
- RSI
- Gann
- ADXR
- Stochastics
- Volume
- Triangles
- Futures
- Cycles
- Volatility
- ZIGZAG
- MESA
- Retracement
- Aroon
INDICATORS LIST
LIST OF TOPICS
PRINT THIS ARTICLE
by Kevin Hopson
The recent consolidation pattern confirms the long-term uptrend for Cimarex Energy and the likelihood for higher prices.
Position: Hold
Kevin Hopson
Kevin has been a technical analyst for roughly 10 years now. Previously, Kevin owned his own business and acted as a registered investment advisor, specializing in energy. He was also a freelance oil analyst for Orient Trading Co., a commodity futures trading firm in Japan. Kevin is currently a freelance writer.
PRINT THIS ARTICLE
CUP WITH HANDLE
Cimarex Energy's Cup And Handle Breakout
09/22/04 03:47:26 PMby Kevin Hopson
The recent consolidation pattern confirms the long-term uptrend for Cimarex Energy and the likelihood for higher prices.
Position: Hold
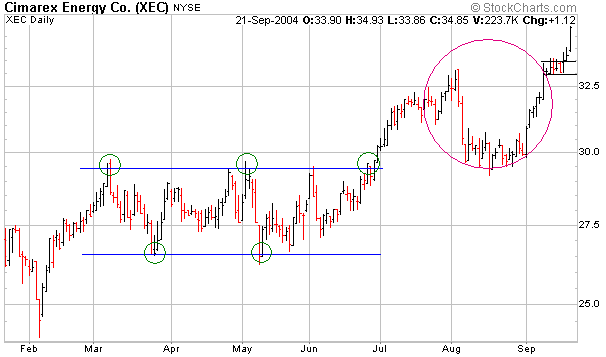
| I last touched on Cimarex Energy (XEC) in late August 2004. At that time, the stock was testing the upper channel line of a prior trading range between $26.50 and $29.50. Since prior resistance levels tend to act as support and the trading range breakout in late June signaled higher prices, I recommended holding shares of Cimarex Energy in anticipation of another rally. |
| More specifically, the trading range breakout indicated an upside target of $35.50 to $38.50. I calculated this price target by taking the number of times that the stock tested the upper channel line in alternate sequence before breaking out (3), multiplying this number by the width of the trading range ($29.50-$26.50=$3.00) and adding this (3*$3.00=$9.00) to the bottom ($26.50+$9.00=$35.50) and top ($29.50+$9.00=$38.50) channel lines. |

|
| Graphic provided by: Stockcharts.com. |
| |
| As you can see, Cimarex found support around the $29.50 level and proceeded to move higher. In doing so, the stock formed a nice U-shape (or cup pattern), as illustrated by the pink circle. Just last week, Cimarex formed a small trading range -- or handle -- to complete the cup pattern. When you put these two patterns together, you get a cup and handle formation. Cup and handle formations tend to be a continuation pattern, so the recent breakout confirms the long-term uptrend. |
| If you take the distance from the left side of the cup to the bottom of the cup ($33.00-$29.50=$3.50) and add this number to the breakout point ($33.50+$3.50), you come up with a potential price target of $37.00. Since this price level is in the middle of my initial target range ($35.50-$38.50), I believe Cimarex has additional upside potential in the near term. As a result, I would continue to hold shares of Cimarex until the chart says otherwise. |
Kevin has been a technical analyst for roughly 10 years now. Previously, Kevin owned his own business and acted as a registered investment advisor, specializing in energy. He was also a freelance oil analyst for Orient Trading Co., a commodity futures trading firm in Japan. Kevin is currently a freelance writer.
| Glen Allen, VA | |
| E-mail address: | hopson_1@yahoo.com |
Click here for more information about our publications!
Comments
Date: 09/22/04Rank: 4Comment:

|

Request Information From Our Sponsors
- StockCharts.com, Inc.
- Candle Patterns
- Candlestick Charting Explained
- Intermarket Technical Analysis
- John Murphy on Chart Analysis
- John Murphy's Chart Pattern Recognition
- John Murphy's Market Message
- MurphyExplainsMarketAnalysis-Intermarket Analysis
- MurphyExplainsMarketAnalysis-Visual Analysis
- StockCharts.com
- Technical Analysis of the Financial Markets
- The Visual Investor
- VectorVest, Inc.
- Executive Premier Workshop
- One-Day Options Course
- OptionsPro
- Retirement Income Workshop
- Sure-Fire Trading Systems (VectorVest, Inc.)
- Trading as a Business Workshop
- VectorVest 7 EOD
- VectorVest 7 RealTime/IntraDay
- VectorVest AutoTester
- VectorVest Educational Services
- VectorVest OnLine
- VectorVest Options Analyzer
- VectorVest ProGraphics v6.0
- VectorVest ProTrader 7
- VectorVest RealTime Derby Tool
- VectorVest Simulator
- VectorVest Variator
- VectorVest Watchdog
