HOT TOPICS LIST
- MACD
- Fibonacci
- RSI
- Gann
- ADXR
- Stochastics
- Volume
- Triangles
- Futures
- Cycles
- Volatility
- ZIGZAG
- MESA
- Retracement
- Aroon
INDICATORS LIST
LIST OF TOPICS
PRINT THIS ARTICLE
by Gary Grosschadl
This gold index is leading several other gold indexes in an apparent breakout attempt. This could be an early bullish signal.
Position: Buy
Gary Grosschadl
Independent Canadian equities trader and technical analyst based in Peterborough
Ontario, Canada.
PRINT THIS ARTICLE
ASCENDING TRIANGLES
XAU Gold Index Tries A Breakout
09/22/04 02:31:42 PMby Gary Grosschadl
This gold index is leading several other gold indexes in an apparent breakout attempt. This could be an early bullish signal.
Position: Buy
| Gold traders often monitor several gold indexes to get an early read of a possible breakout or breakdown. I watch this XAU index, the TSX Gold Index 9($SPTSEGD), the Gold Bugs Index (HUI), and the Gold Continuous Contract ($GOLD). Today's move has the XAU and the gold bugs index making similar bullish moves. |
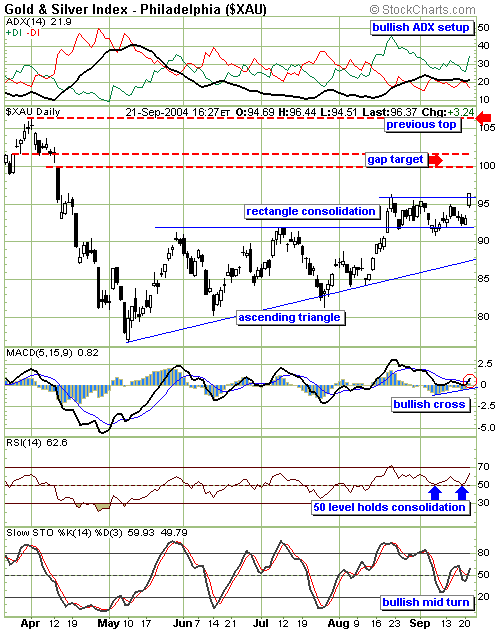
| This daily chart shows a rising bottom pattern in the form of an ascending triangle. The initial breakout from this triangle was a bold two-day pop that resulted in a sideways move for several weeks. This took the shape of a rectangular consolidation. Breakouts from triangles often have a future retest of that trendline break, but this pattern was a mundane unconvincing break. Now it appears that the former bullish move may be renewed with some vigorous judging by the gap open and the bullish close. |

|
| This Gold Index launches higher on this daily chart. |
| Graphic provided by: stockcharts.com. |
| |
| The chart shows two upside targets to consider should this move find some legs. The first one is a previous gap target between 100 and 102. Some traders will likely take profits here. If too many do, then a more serious reversal could occur. An orderly consolidation here, before tackling the higher target represented by the previous high (near 106), is another possibility. |
| Several indicators are worth noting. The directional movement indicator (above Figure 1) shows a bullish setup with the ADX starting to upslope above 20 while the DIs are in a positive setup (+DI above -DI). This hints at growing trend strength. Short-term MACD (moving average convergence/divergence) is showing a bullish cross, foretold by its rising histogram. The RSI (relative strength index) shows a good consolidation pattern with the 50 level holding support. Finally, the stochastic indicator is showing a bullish turn from the 50 level, another sign of a move off consolidation with upside room. |
| Gold moves in the short term tend to have quick runups, and then profit takers take their pound of flesh. Traders have learned not to overstay most forays higher so traders should have a trading strategy prepared for any eventuality. |
Independent Canadian equities trader and technical analyst based in Peterborough
Ontario, Canada.
| Website: | www.whatsonsale.ca/financial.html |
| E-mail address: | gwg7@sympatico.ca |
Click here for more information about our publications!
Comments
Date: 09/22/04Rank: 4Comment:
Date: 09/22/04Rank: 5Comment:

Request Information From Our Sponsors
- StockCharts.com, Inc.
- Candle Patterns
- Candlestick Charting Explained
- Intermarket Technical Analysis
- John Murphy on Chart Analysis
- John Murphy's Chart Pattern Recognition
- John Murphy's Market Message
- MurphyExplainsMarketAnalysis-Intermarket Analysis
- MurphyExplainsMarketAnalysis-Visual Analysis
- StockCharts.com
- Technical Analysis of the Financial Markets
- The Visual Investor
- VectorVest, Inc.
- Executive Premier Workshop
- One-Day Options Course
- OptionsPro
- Retirement Income Workshop
- Sure-Fire Trading Systems (VectorVest, Inc.)
- Trading as a Business Workshop
- VectorVest 7 EOD
- VectorVest 7 RealTime/IntraDay
- VectorVest AutoTester
- VectorVest Educational Services
- VectorVest OnLine
- VectorVest Options Analyzer
- VectorVest ProGraphics v6.0
- VectorVest ProTrader 7
- VectorVest RealTime Derby Tool
- VectorVest Simulator
- VectorVest Variator
- VectorVest Watchdog
