HOT TOPICS LIST
- MACD
- Fibonacci
- RSI
- Gann
- ADXR
- Stochastics
- Volume
- Triangles
- Futures
- Cycles
- Volatility
- ZIGZAG
- MESA
- Retracement
- Aroon
INDICATORS LIST
LIST OF TOPICS
PRINT THIS ARTICLE
by Kevin Hopson
The rally in FuelCell Energy will likely continue.
Position: Hold
Kevin Hopson
Kevin has been a technical analyst for roughly 10 years now. Previously, Kevin owned his own business and acted as a registered investment advisor, specializing in energy. He was also a freelance oil analyst for Orient Trading Co., a commodity futures trading firm in Japan. Kevin is currently a freelance writer.
PRINT THIS ARTICLE
TECHNICAL ANALYSIS
FuelCell Energy Looking Strong
09/21/04 08:43:17 AMby Kevin Hopson
The rally in FuelCell Energy will likely continue.
Position: Hold
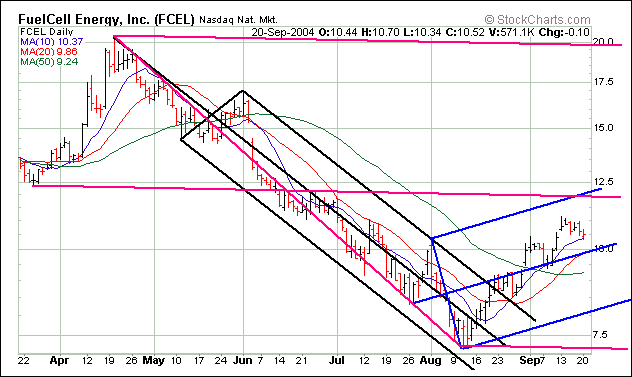
| I last time I touched on FuelCell Energy (FCEL) was back in August. At that time the stock was stuck in a falling channel formation, as illustrated by the black pitchfork configuration. In addition, FuelCell was showing bullish divergences on the daily chart, which were indicative of a forthcoming bottom reversal. As you can see, the stock broke out of the black pitchfork configuration in mid-August, at which point the short-term trend turned positive, confirming the bottom reversal theory. |
| Since bottoming out, FuelCell has continued to move higher along its rising 10-day moving average. The question now is, where does the stock go from here? Looking at the six-month chart, the $12.00 level is an attainable price target in the short-term. This is the site of the purple median line. Since median lines tend to act as significant reversal points, there appears to be more room to run. |

|
| Graphic provided by: Stockcharts.com. |
| |
| FuelCell has also been trading in the upper half of the blue pitchfork since late August. Because the stock has yet to test the top parallel line, this could be a near-term upside objective. Not coincidentally, this pitchfork line comes into play around the $12.00 level. Also coming into play is the 38.2 percent retracement ($12.18) from the April-August decline. Given the additional upside potential in the near-term, I would continue to hold shares of FuelCell Energy. If you are looking to go long, the $10.00 level - the site of the blue median line and the stock's 20-day moving average - appears to be solid short-term support. |
Kevin has been a technical analyst for roughly 10 years now. Previously, Kevin owned his own business and acted as a registered investment advisor, specializing in energy. He was also a freelance oil analyst for Orient Trading Co., a commodity futures trading firm in Japan. Kevin is currently a freelance writer.
| Glen Allen, VA | |
| E-mail address: | hopson_1@yahoo.com |
Click here for more information about our publications!
Comments
Date: 09/21/04Rank: 5Comment: Could you please detail the Alt.Energy stocks performancewith respect to rising oil gas prices ?
Mukund Vasa: email: mukundvasa2000@yahoo.com
Date: 09/22/04Rank: 3Comment:

Request Information From Our Sponsors
- VectorVest, Inc.
- Executive Premier Workshop
- One-Day Options Course
- OptionsPro
- Retirement Income Workshop
- Sure-Fire Trading Systems (VectorVest, Inc.)
- Trading as a Business Workshop
- VectorVest 7 EOD
- VectorVest 7 RealTime/IntraDay
- VectorVest AutoTester
- VectorVest Educational Services
- VectorVest OnLine
- VectorVest Options Analyzer
- VectorVest ProGraphics v6.0
- VectorVest ProTrader 7
- VectorVest RealTime Derby Tool
- VectorVest Simulator
- VectorVest Variator
- VectorVest Watchdog
- StockCharts.com, Inc.
- Candle Patterns
- Candlestick Charting Explained
- Intermarket Technical Analysis
- John Murphy on Chart Analysis
- John Murphy's Chart Pattern Recognition
- John Murphy's Market Message
- MurphyExplainsMarketAnalysis-Intermarket Analysis
- MurphyExplainsMarketAnalysis-Visual Analysis
- StockCharts.com
- Technical Analysis of the Financial Markets
- The Visual Investor
