HOT TOPICS LIST
- MACD
- Fibonacci
- RSI
- Gann
- ADXR
- Stochastics
- Volume
- Triangles
- Futures
- Cycles
- Volatility
- ZIGZAG
- MESA
- Retracement
- Aroon
INDICATORS LIST
LIST OF TOPICS
PRINT THIS ARTICLE
by Chris Manuell
The Shanghai Composite Index (SSEC) tracks yuan-denominated Class A shares and dollar-denominated Class B shares.
Position: N/A
Chris Manuell
Chris Manuell spent 7 years as a futures sales/trader for a large investment bank and more recently as a technical analyst for an independent research company. He has a bachelor of economics and graduate diploma in applied finance & investment. Currently enrolled in the CMT program with the MTA.
PRINT THIS ARTICLE
Shanghai Composite Index Springs From Cycle Low
09/21/04 12:43:20 PMby Chris Manuell
The Shanghai Composite Index (SSEC) tracks yuan-denominated Class A shares and dollar-denominated Class B shares.
Position: N/A
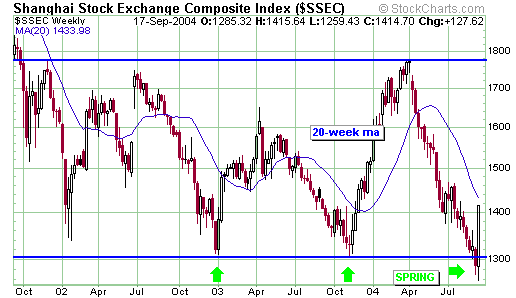
| The SSEC enjoyed an aggressive bounce last week, which appears to have reversed the downtrend from April. Richard Wyckoff, the legendary trader and newsletter writer of the early twentieth century, developed a simple trading technique that can be applied to the weekly chart of the SSEC. |
| Wyckoff introduced the spring, which unfolds when the market penetrates a horizontal support area and then "springs" back above that prior horizontal support line. The trading theme states that new lows can't hold; and there are a plethora of trading descriptions including 2B low and false-break to interpret the upcoming price moves. |

|
| Figure 1: Weekly chart of SSEC with 20-week MA. |
| Graphic provided by: Stockcharts.com. |
| |
| The spring then enables traders to develop a trading strategy with a stop-loss zone and a price target. One basic strategy would be to use the recent low as a stop level, with the target being the high prior to the spring or the top end of the trading range. In the case of SSEC this was the swing high in April at 1,778.09. |
| The case for a successful spring is reinforced by the weekly bullish engulfing pattern that developed following the rejection of new lows. The bullish engulfing candlestick is a major reversal pattern. It is made up of two opposite colored real bodies. Following a downtrend a white bullish body "engulfs" the prior period's black real body. The SSEC's white body from September 13 swallowed seven prior bodies - intensifying the significance of the bullish engulfing pattern. |
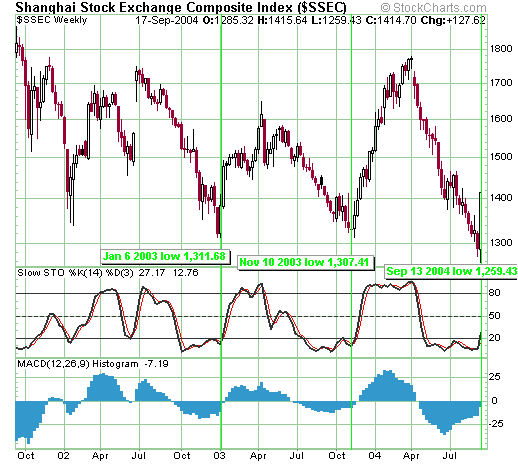
A cursory glance at the recent troughs on the trading range from the weekly SSEC also demonstrates a cyclic theme. Cyclic analysts prefer to measure cycle lengths from trough to trough. The recent low from September 13 was matched by equal intervals from the November 10, 2003 and January 6, 2003 troughs. This underscores the potential for a swing higher and bounce from the lower horizontal trading range.  Figure 2: Weekly chart of SSEC with indicators at bottom. Indicators also complement the potential for a move higher, with the weekly slow stochastics having moved above its lower reference line. These signals work best when the market is in a trading range - such as the 3-year trading range of SSEC. The weekly MACD histogram is also poised to breach the zero line, which should give further impetus to the move higher. |
Chris Manuell spent 7 years as a futures sales/trader for a large investment bank and more recently as a technical analyst for an independent research company. He has a bachelor of economics and graduate diploma in applied finance & investment. Currently enrolled in the CMT program with the MTA.
| E-mail address: | chrismanuell5@yahoo.co.uk |
Click here for more information about our publications!
Comments
Date: 09/22/04Rank: 3Comment:

Request Information From Our Sponsors
- StockCharts.com, Inc.
- Candle Patterns
- Candlestick Charting Explained
- Intermarket Technical Analysis
- John Murphy on Chart Analysis
- John Murphy's Chart Pattern Recognition
- John Murphy's Market Message
- MurphyExplainsMarketAnalysis-Intermarket Analysis
- MurphyExplainsMarketAnalysis-Visual Analysis
- StockCharts.com
- Technical Analysis of the Financial Markets
- The Visual Investor
- VectorVest, Inc.
- Executive Premier Workshop
- One-Day Options Course
- OptionsPro
- Retirement Income Workshop
- Sure-Fire Trading Systems (VectorVest, Inc.)
- Trading as a Business Workshop
- VectorVest 7 EOD
- VectorVest 7 RealTime/IntraDay
- VectorVest AutoTester
- VectorVest Educational Services
- VectorVest OnLine
- VectorVest Options Analyzer
- VectorVest ProGraphics v6.0
- VectorVest ProTrader 7
- VectorVest RealTime Derby Tool
- VectorVest Simulator
- VectorVest Variator
- VectorVest Watchdog
