HOT TOPICS LIST
- MACD
- Fibonacci
- RSI
- Gann
- ADXR
- Stochastics
- Volume
- Triangles
- Futures
- Cycles
- Volatility
- ZIGZAG
- MESA
- Retracement
- Aroon
INDICATORS LIST
LIST OF TOPICS
PRINT THIS ARTICLE
by Jason Braswell
Crude scaled back substantially from its $49 high, but has sinced regained some ground, as it has consolidated and inched back up to the $45 level. What's in store for the next couple of weeks?
Position: Sell
Jason Braswell
Jason Braswell is the Director of Risk Management Services for Infinite Consulting, LLC. He attended graduate school for mathematics at the University of Florida in Gainesville and is an MTA affiliate.
PRINT THIS ARTICLE
CONSOLID FORMATION
What's Next For Crude?
09/20/04 10:50:07 AMby Jason Braswell
Crude scaled back substantially from its $49 high, but has sinced regained some ground, as it has consolidated and inched back up to the $45 level. What's in store for the next couple of weeks?
Position: Sell
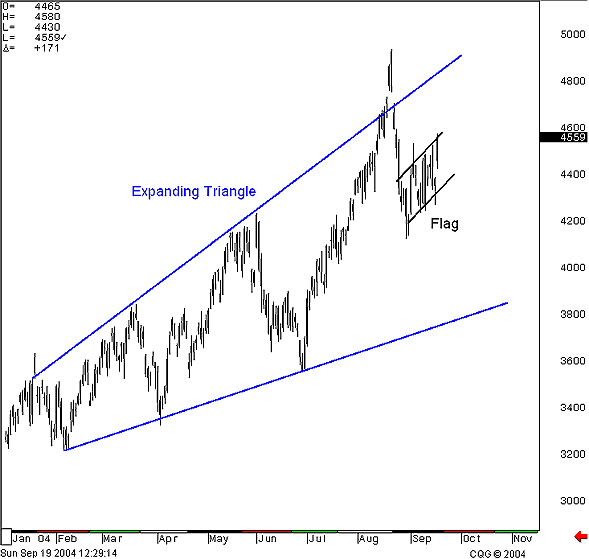
| The last time I looked at crude oil it was trading around $42, and I had pegged it ready for a selloff. Unfortunately for my prognostication, crude kept pushing upward to a high of $49.40, where finally, the rollover from the September to October contract resulted in an island reversal that sent prices to a low of $41.30. Since then, oil has been trending back up, and there's a lot of speculation whether oil will reapproach, and take out, the $50 barrier. |

|
| Figure 1: Daily chart of crude oil. |
| Graphic provided by: CQG Net. |
| |
| The price action since the beginning of this year looks to be developing into an expanding triangle, with the last rally eking out its peak just beyond the triangle's upper boundary. Since making its low, crude has been consolidating in a flag formation, making its way back to a high of $45.80. Provided that the expanding triangle is accurate, prices should break south out of the flag consolidation and continue to move down to at least the bottom of the triangle. This interpretation places the flag right around its textbook "half-mast" position. |
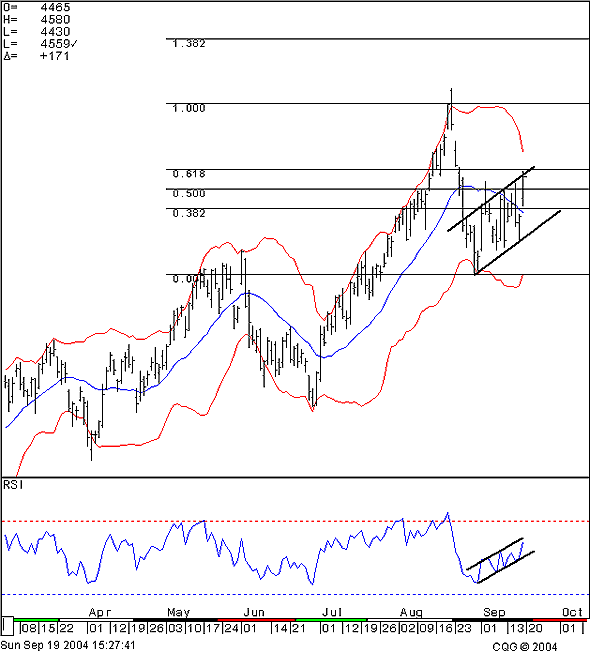
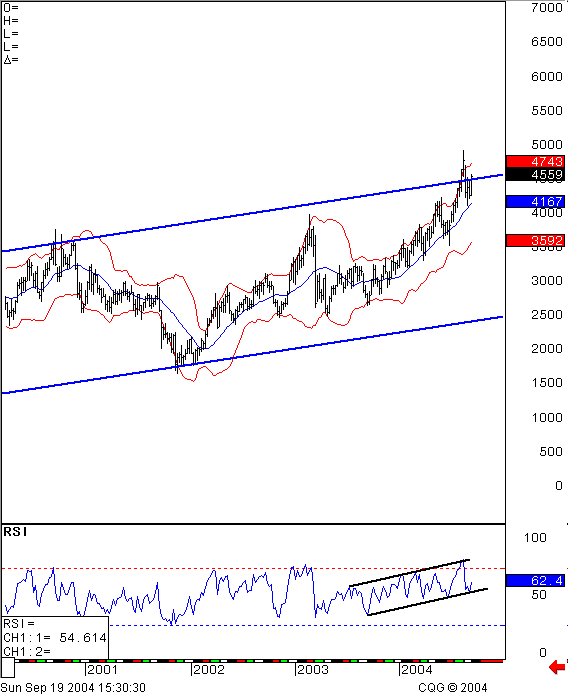
 Figure 2: Close-up of the daily chart of crude. Looking a bit more closely at recent prices in Figure 2, you can see that up until close on September 17th, prices had found resistance, at least on close, at the 20-day moving average. Additionally, the 61.8% retracement level from the prior peak is still holding. Notice that I've placed the top of the grid at $48.75, on the high of the day prior to the actual peak, truncating the spike reversal (see Chapter 6 of Constance Brown's Technical Analysis for the Trading Professional for more).  Figure 3: Weekly chart of crude. On balance, I believe the evidence favors the bears, especially when looking at price action on the weekly chart. As you can see prices are at the very top of a long-term upward channel, giving them little room to rise in the near-term, if the channel is to be respected. However, if trading the short side of the market, keep a close eye on that 61.8% retracement level, as well as the daily chart's RSI level relative to the upward channel that it is tracing out. If these give way, look to cover shorts pronto, as this will favor the current rise, which is the next leg of the uptrend, rather than a pause in the short-term downtrend. |
| And speaking of the RSI, notice that even though price is at the top of a channel on the weekly chart, the RSI is at the bottom of its corresponding channel. There needs to be a downward breakout on the indicator if the price is to follow through as expected. Look to this indicator to help determine if any more breaches of the channel's boundary are noise or legitimate breakouts. |
Jason Braswell is the Director of Risk Management Services for Infinite Consulting, LLC. He attended graduate school for mathematics at the University of Florida in Gainesville and is an MTA affiliate.
| Company: | Infinite Consulting, LLC |
| Website: | www.infiniteconsulting.org |
| E-mail address: | jbraswell@infiniteconsulting.org |
Traders' Resource Links | |
| Infinite Consulting, LLC has not added any product or service information to TRADERS' RESOURCE. | |
Click here for more information about our publications!
Comments
Date: 09/20/04Rank: 5Comment:
Date: 09/21/04Rank: 5Comment:
Date: 09/21/04Rank: 5Comment: The charts and indicators, do they really reflect Russian stoppage of crude oil to China ? and Iraq situation ? The prices may be news driven with hardly any bearing with BB, RSI or Flags etc.
Date: 09/22/04Rank: 3Comment:

|

Request Information From Our Sponsors
- StockCharts.com, Inc.
- Candle Patterns
- Candlestick Charting Explained
- Intermarket Technical Analysis
- John Murphy on Chart Analysis
- John Murphy's Chart Pattern Recognition
- John Murphy's Market Message
- MurphyExplainsMarketAnalysis-Intermarket Analysis
- MurphyExplainsMarketAnalysis-Visual Analysis
- StockCharts.com
- Technical Analysis of the Financial Markets
- The Visual Investor
- VectorVest, Inc.
- Executive Premier Workshop
- One-Day Options Course
- OptionsPro
- Retirement Income Workshop
- Sure-Fire Trading Systems (VectorVest, Inc.)
- Trading as a Business Workshop
- VectorVest 7 EOD
- VectorVest 7 RealTime/IntraDay
- VectorVest AutoTester
- VectorVest Educational Services
- VectorVest OnLine
- VectorVest Options Analyzer
- VectorVest ProGraphics v6.0
- VectorVest ProTrader 7
- VectorVest RealTime Derby Tool
- VectorVest Simulator
- VectorVest Variator
- VectorVest Watchdog
