HOT TOPICS LIST
- MACD
- Fibonacci
- RSI
- Gann
- ADXR
- Stochastics
- Volume
- Triangles
- Futures
- Cycles
- Volatility
- ZIGZAG
- MESA
- Retracement
- Aroon
INDICATORS LIST
LIST OF TOPICS
PRINT THIS ARTICLE
by Koos van der Merwe
Aastrom Biosciences, Inc. (ASTM) is developing automated clinical systems designed to enable therapeutic procedures using living cells in the treatment of cancer and other diseases and in the restoration of normal tissues.
Position: Accumulate
Koos van der Merwe
Has been a technical analyst since 1969, and has worked as a futures and options trader with First Financial Futures in Johannesburg, South Africa.
PRINT THIS ARTICLE
MOVING AVERAGES
Aastrom Biosciences Inc.
09/20/04 08:52:08 AMby Koos van der Merwe
Aastrom Biosciences, Inc. (ASTM) is developing automated clinical systems designed to enable therapeutic procedures using living cells in the treatment of cancer and other diseases and in the restoration of normal tissues.
Position: Accumulate
| The AastromReplicell Cell Production System, the company's leading product, is currently in multi-site U.S. clinical trials for the production of either bone marrow or umbilical cord blood cells to mitigate the toxicity of aggressive chemotherapy used to treat cancer and other blood disorders. Should its trials be positive, the price of the share would soar. |
| Sounds good, but investing in Biosciences are always a gamble. Why? The human body is the greatest chemical factory ever created, and when a gene becomes faulty and starts producing the wrong chemical, synthesizing the original, or finding an alternative to that gene costs an incredible amount of money. Years of research can become a matter of "well, at least we know this doesn't work." But when the next Prozac is discovered, the reward is well worth the risk. |

|
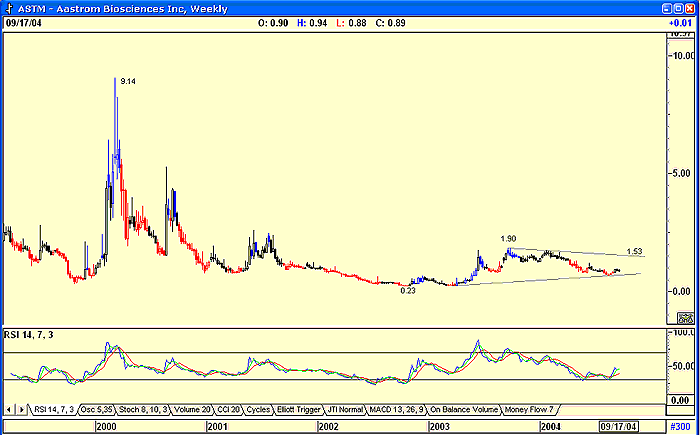
| Figure 1: Aastrom Biosciences weekly chart. |
| Graphic provided by: AdvancedGET. |
| |
| As you can see from the weekly chart, Aastrom Bioscience is one of those companies that draw a great deal of hope. The company reached a high of $9.14 in March 2000, the height of the bubble, and has fallen heavily since then, reaching a low of 0.23 in October 2002. From that date on it is a speculative stock, moving to a high of $1.90 in October 2003, and falling to a low of 0.63 in August 2004. Its move to $0.90 is probably based on hope once again, but the stock is a good speculative investment, and the volatility can be taken advantage of. To do this, I look at a daily chart. The weekly chart also shows the RSI indicator has made a double bottom, and could be suggesting a long-term buy. The resistance line is suggesting a target in the region of $1.53. |
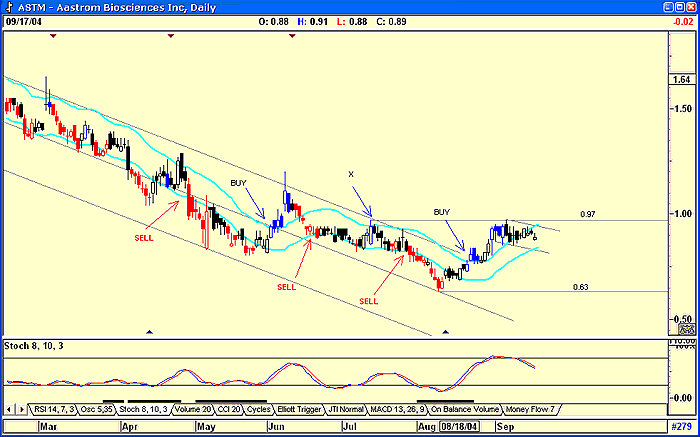
 Figure 2: Daily chart of ASTM. The chart shows a JM Internal Band strategy with the buy and sell signals clearly shown. A JM internal band is a 15-period simple moving average offset, in the case of Aastrom, by 6% positive and -6% negative. All the buy and sell signals are clearly defined, and would have presented good profits. You may have been hesitant with the possible buy signal at "X," but it is the close that constitutes a buy, not the high of the day. The other indicator shown is the XTL (eXpert Trend Locator ). It is a propriety indicator of Advanced GET. A blue bar suggests a buy; black, neutral; and red, a sell. The XTL Parameter uses a statistical evaluation of the market that can tell the difference between random market swings (noise) and directed market swings (trends). I am inclined to use the indicator as a supplement to the JM indicator, but it can be used as a leading indicator for more aggressive trading. Finally, the stochastic indicator shown is suggesting a down move. This ties in with the possible flag that seems to be developing as the price consolidates at present levels. |
| To conclude, although the price has moved up strongly in recent weeks from 0.63 to 0.97, the double top formed at this level does appear to be a formidable resistance level. The flag that appears to be forming will only suggest a buy should the price break above the upper "flag" resistance line. This is a share worth watching. |
Has been a technical analyst since 1969, and has worked as a futures and options trader with First Financial Futures in Johannesburg, South Africa.
| Address: | 3256 West 24th Ave |
| Vancouver, BC | |
| Phone # for sales: | 6042634214 |
| E-mail address: | petroosp@gmail.com |
Click here for more information about our publications!
Comments
Date: 09/22/04Rank: 3Comment:

Request Information From Our Sponsors
- StockCharts.com, Inc.
- Candle Patterns
- Candlestick Charting Explained
- Intermarket Technical Analysis
- John Murphy on Chart Analysis
- John Murphy's Chart Pattern Recognition
- John Murphy's Market Message
- MurphyExplainsMarketAnalysis-Intermarket Analysis
- MurphyExplainsMarketAnalysis-Visual Analysis
- StockCharts.com
- Technical Analysis of the Financial Markets
- The Visual Investor
- VectorVest, Inc.
- Executive Premier Workshop
- One-Day Options Course
- OptionsPro
- Retirement Income Workshop
- Sure-Fire Trading Systems (VectorVest, Inc.)
- Trading as a Business Workshop
- VectorVest 7 EOD
- VectorVest 7 RealTime/IntraDay
- VectorVest AutoTester
- VectorVest Educational Services
- VectorVest OnLine
- VectorVest Options Analyzer
- VectorVest ProGraphics v6.0
- VectorVest ProTrader 7
- VectorVest RealTime Derby Tool
- VectorVest Simulator
- VectorVest Variator
- VectorVest Watchdog
