HOT TOPICS LIST
- MACD
- Fibonacci
- RSI
- Gann
- ADXR
- Stochastics
- Volume
- Triangles
- Futures
- Cycles
- Volatility
- ZIGZAG
- MESA
- Retracement
- Aroon
INDICATORS LIST
LIST OF TOPICS
PRINT THIS ARTICLE
by Sean Moore
Many technical indicators and trading systems aim to identify market acceleration and deceleration. This acceleration factor can be a good indication of changing market momentum.
Position: N/A
Sean Moore
Traders.com Staff Writer.
PRINT THIS ARTICLE
ACCELERATION
Acceleration
05/24/00 10:34:41 AMby Sean Moore
Many technical indicators and trading systems aim to identify market acceleration and deceleration. This acceleration factor can be a good indication of changing market momentum.
Position: N/A
| Over the years, many indicators have been developed for measuring market acceleration. Acceleration is a sign of positive changes to momentum, while deceleration is a sign of negative changes to momentum. Momentum is defined as the speed of a price's movement, and acceleration is the speeding up or slowing down of the momentum. They are used to detect changes in the market direction. |
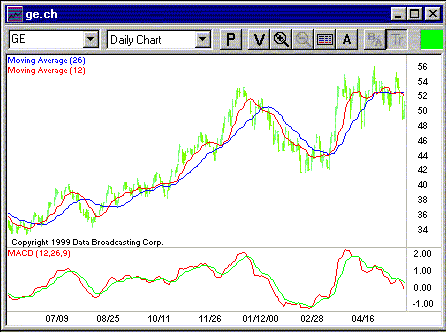
| A common momentum indicator that can be used to help denote market acceleration is the Moving Average Convergence/Divergence (MACD). This indicator can be plotted with a bar chart showing the difference between a fast (shorter-period) moving average and a slow (longer-period) moving average. You can either use a simple or exponential moving average to calculate the MACD. When the faster moving average crosses above the slower moving average, it is a sign of positive acceleration (momentum is increasing) and, thus is a potential entry point. Conversely, when the faster moving average crosses below the slower moving average, it is a potential exit point. This indicator works best in a trending market but tends to lose its efficiency in a volatile one because it will generate whipsaws. |

|
| Figure 1: Daily bar chart for GE plotted with 12/26 moving averages and MACD. MACD histogram plots momentum. Changing momentum denotes acceleration |
| Graphic provided by: TradeStation. |
| |
| Figure 1 shows a daily bar chart for General Electric Co. The 12-day simple moving average (red line) and 26-day simple moving average (blue line) are plotted across the daily OHLC bars. Buy and sell signals are created when the two lines cross. |
| The concept of acceleration within the financial markets has certainly been an important issue behind measuring market momentum. The MACD is a visual representation of market momentum. The rate at which this momentum changes is defined as the acceleration and changes in this acceleration are often followed by a reversal of price direction or a significant upward or downward move. |
Traders.com Staff Writer.
| Title: | Project Engineer |
| Company: | Technical Analysis, Inc. |
| Address: | 4757 California Ave. SW |
| Seattle, WA 98116 | |
| Phone # for sales: | 206 938 0570 |
| Fax: | 206 938 1307 |
| Website: | Traders.com |
| E-mail address: | smoore@traders.com |
Traders' Resource Links | |
| Charting the Stock Market: The Wyckoff Method -- Books | |
| Working-Money.com -- Online Trading Services | |
| Traders.com Advantage -- Online Trading Services | |
| Technical Analysis of Stocks & Commodities -- Publications and Newsletters | |
| Working Money, at Working-Money.com -- Publications and Newsletters | |
| Traders.com Advantage -- Publications and Newsletters | |
| Professional Traders Starter Kit -- Software | |
Click here for more information about our publications!
Comments

|

Request Information From Our Sponsors
- StockCharts.com, Inc.
- Candle Patterns
- Candlestick Charting Explained
- Intermarket Technical Analysis
- John Murphy on Chart Analysis
- John Murphy's Chart Pattern Recognition
- John Murphy's Market Message
- MurphyExplainsMarketAnalysis-Intermarket Analysis
- MurphyExplainsMarketAnalysis-Visual Analysis
- StockCharts.com
- Technical Analysis of the Financial Markets
- The Visual Investor
- VectorVest, Inc.
- Executive Premier Workshop
- One-Day Options Course
- OptionsPro
- Retirement Income Workshop
- Sure-Fire Trading Systems (VectorVest, Inc.)
- Trading as a Business Workshop
- VectorVest 7 EOD
- VectorVest 7 RealTime/IntraDay
- VectorVest AutoTester
- VectorVest Educational Services
- VectorVest OnLine
- VectorVest Options Analyzer
- VectorVest ProGraphics v6.0
- VectorVest ProTrader 7
- VectorVest RealTime Derby Tool
- VectorVest Simulator
- VectorVest Variator
- VectorVest Watchdog
