HOT TOPICS LIST
- MACD
- Fibonacci
- RSI
- Gann
- ADXR
- Stochastics
- Volume
- Triangles
- Futures
- Cycles
- Volatility
- ZIGZAG
- MESA
- Retracement
- Aroon
INDICATORS LIST
LIST OF TOPICS
PRINT THIS ARTICLE
by Kevin Hopson
Another potentially bullish pattern for the Oil Services Index could lead to a resumption of the long-term uptrend.
Position: Hold
Kevin Hopson
Kevin has been a technical analyst for roughly 10 years now. Previously, Kevin owned his own business and acted as a registered investment advisor, specializing in energy. He was also a freelance oil analyst for Orient Trading Co., a commodity futures trading firm in Japan. Kevin is currently a freelance writer.
PRINT THIS ARTICLE
HEAD & SHOULDERS
A Reverse Head And Shoulders Formation For The Oil Services Index?
09/17/04 08:51:09 AMby Kevin Hopson
Another potentially bullish pattern for the Oil Services Index could lead to a resumption of the long-term uptrend.
Position: Hold
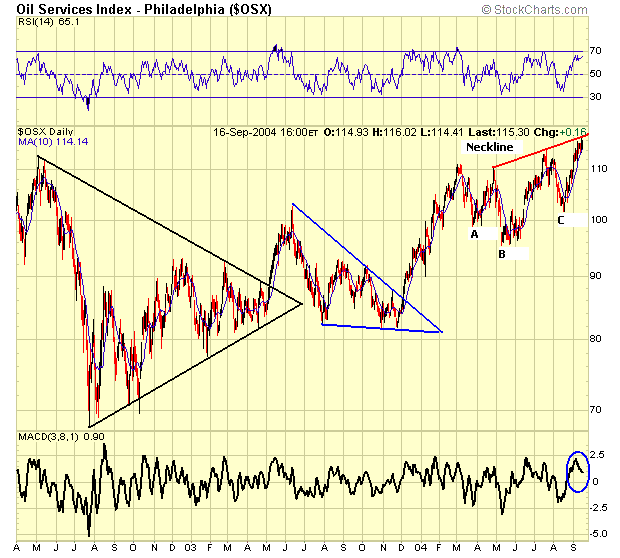
| The Oil Services Index (OSX) has shown several bullish patterns over the past 30 months (2 years). If you look at the chart, you will see what I am talking about. Notice how the index broke out of a bullish triangle formation last summer (2003), as illustrated by the black trendlines. This is considered bullish because symmetrical triangles tend to be continuation patterns and the prior move was up. The long-term price target based on the triangle breakout is 132. I calculated this by taking the base of the triangle (high point minus low point) and adding this number (112 - 68 = 44) to the breakout point (88 + 44 = 132). |
| After the index broke out, prices started to consolidate in a falling wedge formation, as illustrated by the blue trendlines. Wedge formations normally break in the opposite direction of the sloping triangle, so falling wedges tend to be bullish. The index broke to the upside from this formation and continued to rally. This brings us to the next potential bullish pattern: a possible reverse head and shoulders. This formation tends to be a bottoming pattern, and in this instance, could lead to a resumption of the index's long-term uptrend. |

|
| Graphic provided by: Stockcharts.com. |
| |
| On the chart, A represents the left shoulder, B represents the head, and C represents the right shoulder. The neckline is drawn from the completion point of the left shoulder to the completion point of the head. As you can see, the neckline - which needs to be breached for a breakout to occur - is acting as resistance right now. If the index can breach resistance here, prices could eventually make their way above the 130 level, which coincides with the initial price target from last year's triangle breakout. I calculated this price target by taking the distance from the completion point of the left shoulder to the bottom of the head (110 - 96 = 14) and adding this number to the current neckline breakout point (117 + 14 = 131). Given the attractive upside that still remains, I would continue to hold shares of oil service stocks and look to accumulate on significant weakness. |
Kevin has been a technical analyst for roughly 10 years now. Previously, Kevin owned his own business and acted as a registered investment advisor, specializing in energy. He was also a freelance oil analyst for Orient Trading Co., a commodity futures trading firm in Japan. Kevin is currently a freelance writer.
| Glen Allen, VA | |
| E-mail address: | hopson_1@yahoo.com |
Click here for more information about our publications!
Comments
Date: 09/21/04Rank: 5Comment:
Date: 09/22/04Rank: 4Comment:

Request Information From Our Sponsors
- VectorVest, Inc.
- Executive Premier Workshop
- One-Day Options Course
- OptionsPro
- Retirement Income Workshop
- Sure-Fire Trading Systems (VectorVest, Inc.)
- Trading as a Business Workshop
- VectorVest 7 EOD
- VectorVest 7 RealTime/IntraDay
- VectorVest AutoTester
- VectorVest Educational Services
- VectorVest OnLine
- VectorVest Options Analyzer
- VectorVest ProGraphics v6.0
- VectorVest ProTrader 7
- VectorVest RealTime Derby Tool
- VectorVest Simulator
- VectorVest Variator
- VectorVest Watchdog
- StockCharts.com, Inc.
- Candle Patterns
- Candlestick Charting Explained
- Intermarket Technical Analysis
- John Murphy on Chart Analysis
- John Murphy's Chart Pattern Recognition
- John Murphy's Market Message
- MurphyExplainsMarketAnalysis-Intermarket Analysis
- MurphyExplainsMarketAnalysis-Visual Analysis
- StockCharts.com
- Technical Analysis of the Financial Markets
- The Visual Investor
