HOT TOPICS LIST
- MACD
- Fibonacci
- RSI
- Gann
- ADXR
- Stochastics
- Volume
- Triangles
- Futures
- Cycles
- Volatility
- ZIGZAG
- MESA
- Retracement
- Aroon
INDICATORS LIST
LIST OF TOPICS
PRINT THIS ARTICLE
by Arthur Hill
After a big advance in 2003, the iShares MSCI Japan Index (EWJ) has consolidated for most of 2004 and looks ripe for a break. But which way?
Position: Hold
Arthur Hill
Arthur Hill is currently editor of TDTrader.com, a website specializing in trading strategies, sector/industry specific breadth stats and overall technical analysis. He passed the Society of Technical Analysts (STA London) diploma exam with distinction is a Certified Financial Technician (CFTe). Prior to TD Trader, he was the Chief Technical Analyst for Stockcharts.com and the main contributor to the ChartSchool.
PRINT THIS ARTICLE
TRIANGLES
Japan WEBS Coiling Tighter
09/16/04 09:32:20 AMby Arthur Hill
After a big advance in 2003, the iShares MSCI Japan Index (EWJ) has consolidated for most of 2004 and looks ripe for a break. But which way?
Position: Hold
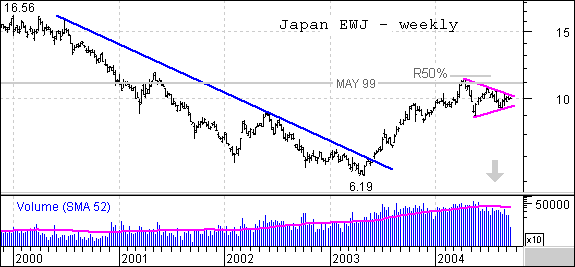
| The advance represents a normal retracement and resistance was not wholly unexpected. After the iShares MSCI Japan Index declined from 16.56 to 6.19, the subsequent advance retraced around 50% of that decline, which is a normal retracement. In addition, resistance around 11 extends back to broken support from the May-99 low. |
 Figure 1: Weekly chart of EWJ showing a symmetrial triangle pattern. Since moving above 10 earlier this year, the stock formed a triangle over the last six months (magenta trendlines). The prior advance was quite sharp and a period of rest is quite normal. Notice how volume expanded during the advance and then contracted during the consolidation or rest period (gray arrow). This is normal and validates the consolidation. The triangle is a neutral pattern and its resolution holds the key. A break to the upside would signal a continuation of the 2003-2004 advance, while a break to the downside would be bearish and lower prices would be forecast. |

|
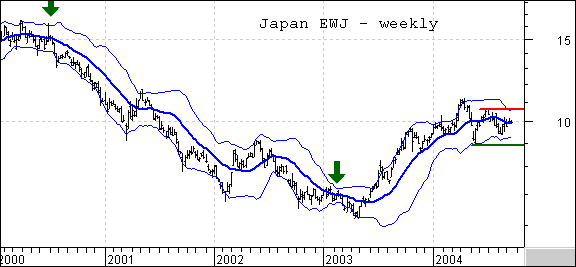
| Figure 2: Weekly chart of EWJ showing Bollinger Bands. |
| Graphic provided by: MetaStock. |
| |
| Judging from recent Bollinger Band action, a break could come sooner rather than later. The Bollinger Bands are at their tightest since Feb-03 and Jun-00, two periods that preceded significant moves. A move above 10.63 (red line) should be considered bullish and a move below 8.88 (green line) bearish. |
Arthur Hill is currently editor of TDTrader.com, a website specializing in trading strategies, sector/industry specific breadth stats and overall technical analysis. He passed the Society of Technical Analysts (STA London) diploma exam with distinction is a Certified Financial Technician (CFTe). Prior to TD Trader, he was the Chief Technical Analyst for Stockcharts.com and the main contributor to the ChartSchool.
| Title: | Editor |
| Company: | TDTrader.com |
| Address: | Willem Geetsstraat 17 |
| Mechelen, B2800 | |
| Phone # for sales: | 3215345465 |
| Website: | www.tdtrader.com |
| E-mail address: | arthurh@tdtrader.com |
Traders' Resource Links | |
| TDTrader.com has not added any product or service information to TRADERS' RESOURCE. | |
Click here for more information about our publications!
Comments
Date: 09/16/04Rank: 4Comment:

Request Information From Our Sponsors
- StockCharts.com, Inc.
- Candle Patterns
- Candlestick Charting Explained
- Intermarket Technical Analysis
- John Murphy on Chart Analysis
- John Murphy's Chart Pattern Recognition
- John Murphy's Market Message
- MurphyExplainsMarketAnalysis-Intermarket Analysis
- MurphyExplainsMarketAnalysis-Visual Analysis
- StockCharts.com
- Technical Analysis of the Financial Markets
- The Visual Investor
- VectorVest, Inc.
- Executive Premier Workshop
- One-Day Options Course
- OptionsPro
- Retirement Income Workshop
- Sure-Fire Trading Systems (VectorVest, Inc.)
- Trading as a Business Workshop
- VectorVest 7 EOD
- VectorVest 7 RealTime/IntraDay
- VectorVest AutoTester
- VectorVest Educational Services
- VectorVest OnLine
- VectorVest Options Analyzer
- VectorVest ProGraphics v6.0
- VectorVest ProTrader 7
- VectorVest RealTime Derby Tool
- VectorVest Simulator
- VectorVest Variator
- VectorVest Watchdog
