HOT TOPICS LIST
- MACD
- Fibonacci
- RSI
- Gann
- ADXR
- Stochastics
- Volume
- Triangles
- Futures
- Cycles
- Volatility
- ZIGZAG
- MESA
- Retracement
- Aroon
INDICATORS LIST
LIST OF TOPICS
PRINT THIS ARTICLE
by Chris Manuell
Eastman Kodak (EK) may be synonymous with shooting stars on the red carpet but another form of shooting star may be responsible for a pause in activity.
Position: N/A
Chris Manuell
Chris Manuell spent 7 years as a futures sales/trader for a large investment bank and more recently as a technical analyst for an independent research company. He has a bachelor of economics and graduate diploma in applied finance & investment. Currently enrolled in the CMT program with the MTA.
PRINT THIS ARTICLE
CANDLESTICK CHARTING
Eastman Kodak - Shooting Stars
09/14/04 12:50:54 PMby Chris Manuell
Eastman Kodak (EK) may be synonymous with shooting stars on the red carpet but another form of shooting star may be responsible for a pause in activity.
Position: N/A
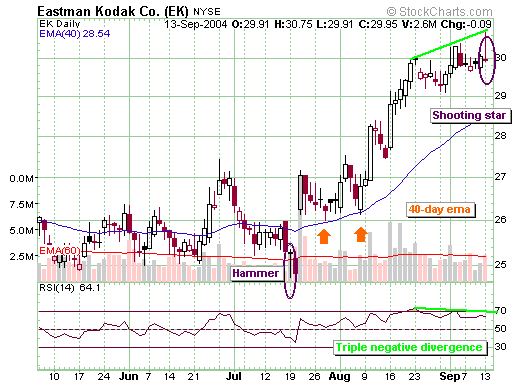
| The shooting star is a candlestick pattern that demonstrates the reluctance of the market to push higher in the near term. The shooting star has a small real body at the lower end of its range with an extended upper shadow. It is not regarded as a major reversal signal but can often provide a minor swing high. The color of the body is immaterial, with the key component the lengthy upper shadow, signalling a rejection of higher prices. |

|
| Figure 1: Daily chart of Kodak. |
| Graphic provided by: StockCharts.com. |
| |
| Eastman Kodak completed a shooting star on September 13 when the market failed to sustain the price move above the 30 region. This suggests that the bears took control on the highs of the session and took prices lower into the close. Kodak has enjoyed a rally from July 19, which was kick-started with a cousin of the shooting star - the hammer. The hammer is characterised by a small body and lengthy lower shadow. RSI is also taking a picture of a market losing bullish momentum with a triple negative divergence emerging. Divergence between price action and the RSI is a very strong indicator of a potential turning point. Kodak managed to push higher in price, however RSI was tracking a path lower and recording two lower peaks. J. Welles Wilder, Jr., in his groundbreaking book, New Concepts in Technical Trading Systems, suggests that divergence unfolds as most "significant turning points" and that "divergence is the single most indicative characteristic" of the RSI. The significance of divergence in Kodak is increased because it takes place with RSI in an overbought reading. |
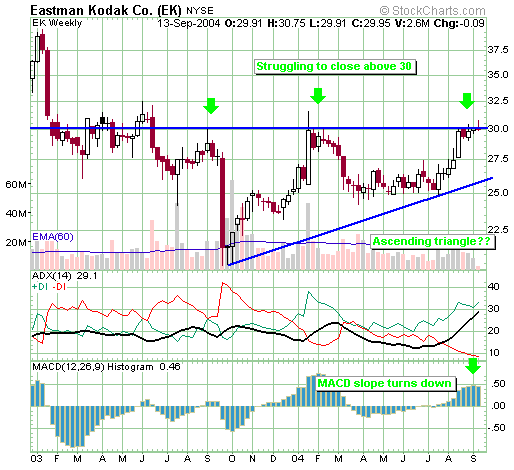
 Figure 2: Weekly chart of Kodak. The weekly chart of Eastman Kodak provides a reason for the appearance of the shooting star at the 30 level on the daily charts. The market has failed to close above that level on numerous attempts in the last year as highlighted in the weekly chart. The weekly MACD histogram slope has also turned down which suggests bullish momentum is waning. If the daily shooting star is successful and signals another failed attempt to break the horizontal resistance line at 30, long-term traders would take interest in the bullish ascending triangle that is unfolding. The rising trendline from the October 2003 low supports the pattern. Long-term traders willing to accumulate positions in anticipation of a closing violation of the 30 horizontal line could wait for a pullback to the 40-day EMA, which provided good support in late July and early August. |
Chris Manuell spent 7 years as a futures sales/trader for a large investment bank and more recently as a technical analyst for an independent research company. He has a bachelor of economics and graduate diploma in applied finance & investment. Currently enrolled in the CMT program with the MTA.
| E-mail address: | chrismanuell5@yahoo.co.uk |
Click here for more information about our publications!
Comments
Date: 09/14/04Rank: 3Comment:

Request Information From Our Sponsors
- StockCharts.com, Inc.
- Candle Patterns
- Candlestick Charting Explained
- Intermarket Technical Analysis
- John Murphy on Chart Analysis
- John Murphy's Chart Pattern Recognition
- John Murphy's Market Message
- MurphyExplainsMarketAnalysis-Intermarket Analysis
- MurphyExplainsMarketAnalysis-Visual Analysis
- StockCharts.com
- Technical Analysis of the Financial Markets
- The Visual Investor
- VectorVest, Inc.
- Executive Premier Workshop
- One-Day Options Course
- OptionsPro
- Retirement Income Workshop
- Sure-Fire Trading Systems (VectorVest, Inc.)
- Trading as a Business Workshop
- VectorVest 7 EOD
- VectorVest 7 RealTime/IntraDay
- VectorVest AutoTester
- VectorVest Educational Services
- VectorVest OnLine
- VectorVest Options Analyzer
- VectorVest ProGraphics v6.0
- VectorVest ProTrader 7
- VectorVest RealTime Derby Tool
- VectorVest Simulator
- VectorVest Variator
- VectorVest Watchdog
