HOT TOPICS LIST
- MACD
- Fibonacci
- RSI
- Gann
- ADXR
- Stochastics
- Volume
- Triangles
- Futures
- Cycles
- Volatility
- ZIGZAG
- MESA
- Retracement
- Aroon
INDICATORS LIST
LIST OF TOPICS
PRINT THIS ARTICLE
by Gary Grosschadl
After a period of sideways consolidation, this high tech index surges higher looking for some upside gains.
Position: Buy
Gary Grosschadl
Independent Canadian equities trader and technical analyst based in Peterborough
Ontario, Canada.
PRINT THIS ARTICLE
ANDREWS PITCH-FORK
Nasdaq Moving Up, But How Far?
09/14/04 01:00:21 PMby Gary Grosschadl
After a period of sideways consolidation, this high tech index surges higher looking for some upside gains.
Position: Buy
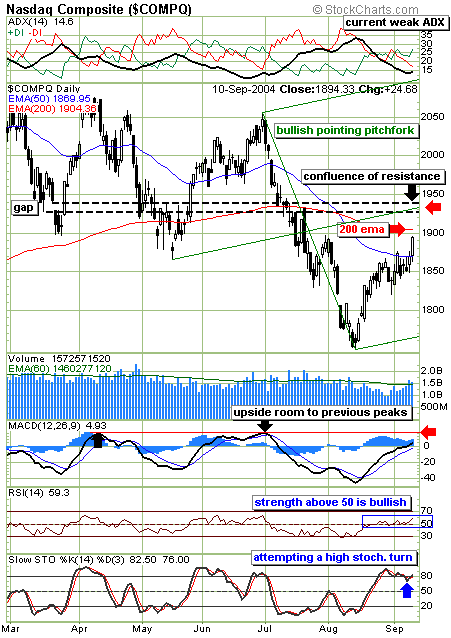
| Following a couple of weeks of respecting overhead resistance, the Nasdaq pushes higher, beating its 50-day EMA. Is this the start of a major upleg or just a teaser? Using three significant turning points, an Andrews Pitchfork is plotted to gain possible insight into this question. A tenet of pitchfork theory is that a move off the lower median line very often reaches the center median line. This gives a likely upside target in the area of 1930. |
| The pitchfork target shown on the chart below has extra significance because it also represents a confluence of resistance. This 1930 area also relates to a previous gap and several strategic candlestick marks being at or near the midpoints of three large candlesticks. Previous gaps often act as future areas of support or resistance as do midpoints of large candlesticks. |

|
| A bullish drive towards the pitchfork median line is likely underway. |
| Graphic provided by: Stockcharts.com. |
| |
| Another factor that may come into play is the 200-day EMA currently at 1904. A push past this mark would be a bullish development and would become a new base for any consolidation before another bull drive north. Should this confluence area halt any advance, then holding support at the 200-day EMA could be an important step to "reloading" before an eventual assault past the 1930 area. |
| Several indicators are also worth consideration. The ADX component at the top of the chart is deemed to be weak at 14.6. Good trend strength normally is indicative with ADX value above 20 to 25. The MACD indicator (moving average convergence/divergence) shows some upside room above the zero level, which is encouraging for the bulls provided there is no stall at the zero level. The RSI (relative strength index) shows bullishness with strength above the often key 50 level while the stochastics indicator hints at the high turn near the 80 level. This would be a bit of an anomaly as high stochastic turns are most often accompanied by strong trend strength as exhibited by higher ADX levels. |
| Traders should anticipate a possible turning point at or near this pitchfork median line, in which case support or lack of support from the 200-day EMA could be a telling factor in what transpires next. |
Independent Canadian equities trader and technical analyst based in Peterborough
Ontario, Canada.
| Website: | www.whatsonsale.ca/financial.html |
| E-mail address: | gwg7@sympatico.ca |
Click here for more information about our publications!
PRINT THIS ARTICLE

Request Information From Our Sponsors
- VectorVest, Inc.
- Executive Premier Workshop
- One-Day Options Course
- OptionsPro
- Retirement Income Workshop
- Sure-Fire Trading Systems (VectorVest, Inc.)
- Trading as a Business Workshop
- VectorVest 7 EOD
- VectorVest 7 RealTime/IntraDay
- VectorVest AutoTester
- VectorVest Educational Services
- VectorVest OnLine
- VectorVest Options Analyzer
- VectorVest ProGraphics v6.0
- VectorVest ProTrader 7
- VectorVest RealTime Derby Tool
- VectorVest Simulator
- VectorVest Variator
- VectorVest Watchdog
- StockCharts.com, Inc.
- Candle Patterns
- Candlestick Charting Explained
- Intermarket Technical Analysis
- John Murphy on Chart Analysis
- John Murphy's Chart Pattern Recognition
- John Murphy's Market Message
- MurphyExplainsMarketAnalysis-Intermarket Analysis
- MurphyExplainsMarketAnalysis-Visual Analysis
- StockCharts.com
- Technical Analysis of the Financial Markets
- The Visual Investor
