HOT TOPICS LIST
- MACD
- Fibonacci
- RSI
- Gann
- ADXR
- Stochastics
- Volume
- Triangles
- Futures
- Cycles
- Volatility
- ZIGZAG
- MESA
- Retracement
- Aroon
INDICATORS LIST
LIST OF TOPICS
PRINT THIS ARTICLE
by Chris Manuell
The semiconductor index (SOX) is a useful barometer for the equity market and it has remained in a steady downtrend for 2004. Recently the market has enjoyed a sharp bounce upward, perhaps signaling a change in the downward trend.
Position: N/A
Chris Manuell
Chris Manuell spent 7 years as a futures sales/trader for a large investment bank and more recently as a technical analyst for an independent research company. He has a bachelor of economics and graduate diploma in applied finance & investment. Currently enrolled in the CMT program with the MTA.
PRINT THIS ARTICLE
BOLLINGER BANDS
SOX Bounces From Turning Point
09/13/04 11:38:34 AMby Chris Manuell
The semiconductor index (SOX) is a useful barometer for the equity market and it has remained in a steady downtrend for 2004. Recently the market has enjoyed a sharp bounce upward, perhaps signaling a change in the downward trend.
Position: N/A
| Bollinger Bands can provide traders with a tool to monitor extreme movements in market prices. They are plotted at standard deviation levels above and below a moving average. A standard deviation is a gauge of volatility, so the bands act as automatic stabilizers, expanding during volatile markets and contracting during stable periods. |

|
| |
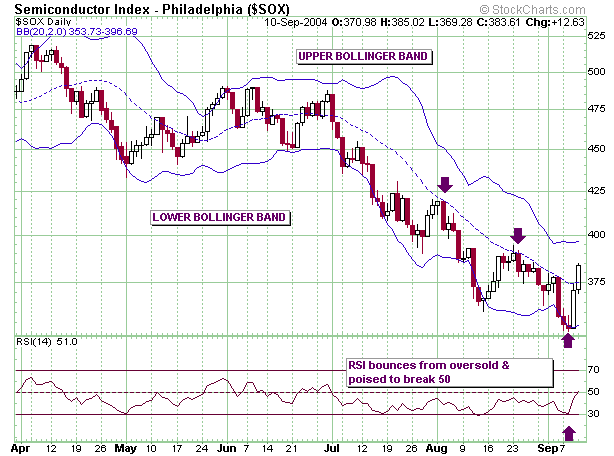
| From September 3 to September 8, the SOX completed three consecutive closes outside of the lower Bollinger Band, highlighting the strength of the bears as they continued to force the market lower. The bears were unable to sustain the weakness with a strong white candle emerging on September 9th. RSI also alerted the traders to an overextended market when it touched an oversold reading. |
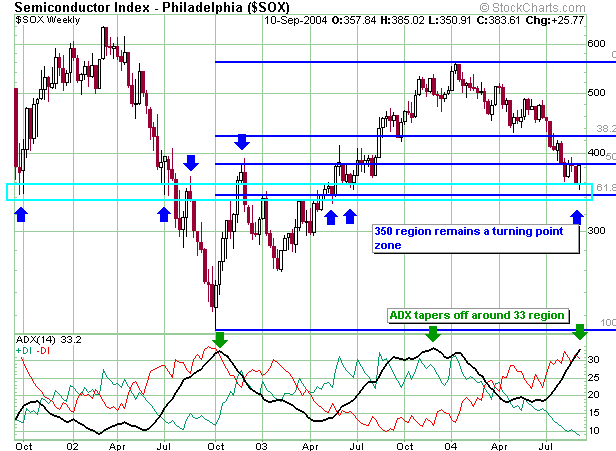
| Bollinger Bands also provide potential price targets. A move that originates at one band tends to gravitate towards the opposite band. The SOX heightened its chance of a move to the upper band in the 400 region when it successfully breached the 20-day MA, or middle band. This had capped prior bounces, as two attempts to close above the middle band in August attest. Savvy traders may have decided to book profits after examining the longer-term chart and discovering a major turning point zone in the 350 region. The SOX has turned from that level on numerous occasions over the last three years. This area also the .618 Fibonacci retracament level of the Oct 2002 to Jan 2004 rally. |
 Figure 2: Weekly chart of the SOX. The weekly ADX is also placed at an intriguing level. The 2002 decline and 2004 rally were both halted when the ADX tapered off around 33. The weekly ADX on the SOX is currently trading at 33.2. Technical analysts are fond of three's. Will this third attempt at 33 on the ADX also mark the end of a trend? |
Chris Manuell spent 7 years as a futures sales/trader for a large investment bank and more recently as a technical analyst for an independent research company. He has a bachelor of economics and graduate diploma in applied finance & investment. Currently enrolled in the CMT program with the MTA.
| E-mail address: | chrismanuell5@yahoo.co.uk |
Click here for more information about our publications!
Comments
Date: 09/14/04Rank: 4Comment:

Request Information From Our Sponsors
- VectorVest, Inc.
- Executive Premier Workshop
- One-Day Options Course
- OptionsPro
- Retirement Income Workshop
- Sure-Fire Trading Systems (VectorVest, Inc.)
- Trading as a Business Workshop
- VectorVest 7 EOD
- VectorVest 7 RealTime/IntraDay
- VectorVest AutoTester
- VectorVest Educational Services
- VectorVest OnLine
- VectorVest Options Analyzer
- VectorVest ProGraphics v6.0
- VectorVest ProTrader 7
- VectorVest RealTime Derby Tool
- VectorVest Simulator
- VectorVest Variator
- VectorVest Watchdog
- StockCharts.com, Inc.
- Candle Patterns
- Candlestick Charting Explained
- Intermarket Technical Analysis
- John Murphy on Chart Analysis
- John Murphy's Chart Pattern Recognition
- John Murphy's Market Message
- MurphyExplainsMarketAnalysis-Intermarket Analysis
- MurphyExplainsMarketAnalysis-Visual Analysis
- StockCharts.com
- Technical Analysis of the Financial Markets
- The Visual Investor
