HOT TOPICS LIST
- MACD
- Fibonacci
- RSI
- Gann
- ADXR
- Stochastics
- Volume
- Triangles
- Futures
- Cycles
- Volatility
- ZIGZAG
- MESA
- Retracement
- Aroon
INDICATORS LIST
LIST OF TOPICS
PRINT THIS ARTICLE
by Chris Manuell
The US 30-year bond has enjoyed an orderly summer rally, which can be demonstrated with the bullish rising channel on the daily chart. Short-term traders could use candlestick analysis in conjunction with the boundary lines of the channel to locate potential swing points.
Position: N/A
Chris Manuell
Chris Manuell spent 7 years as a futures sales/trader for a large investment bank and more recently as a technical analyst for an independent research company. He has a bachelor of economics and graduate diploma in applied finance & investment. Currently enrolled in the CMT program with the MTA.
PRINT THIS ARTICLE
TREND-CHANNEL
30-Year Treasury Bond - Daily Bullish Rising Channel
09/09/04 01:37:51 PMby Chris Manuell
The US 30-year bond has enjoyed an orderly summer rally, which can be demonstrated with the bullish rising channel on the daily chart. Short-term traders could use candlestick analysis in conjunction with the boundary lines of the channel to locate potential swing points.
Position: N/A
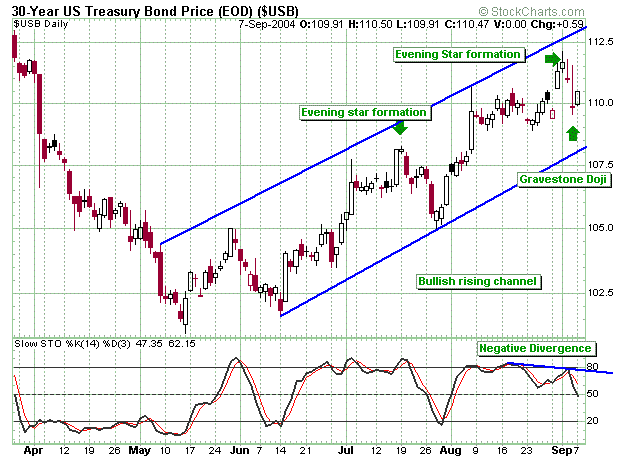
| The 30-year bond has displayed some evening star patterns in the vicinity of the upper boundary of the daily bullish trend channel that have resulted in a correction. The evening star formation is a solid reversal pattern that consists of three candlesticks. The first candle is a long white real body; the next is a small real body that ideally doesn't touch the prior real body. Finally, the third candle should be a dark real body that significantly overlaps into the body of the first candle. |
| Although the chart formations below do not qualify as perfect evening star formations they still reflect the psychology of the pattern. Steve Nison suggests in Japanese Candlestick Charting Techniques that in his experience "even if the second and third candles overlap, it doesn't mitigate the effectiveness of this pattern." |

|
| Figure 1: Daily chart of 30- year US Treasury bonds. |
| Graphic provided by: Stockcharts.com. |
| |
| The first evening star pattern was completed on July 21 and was close to a textbook formation. The strong white candle was followed with a small real body - this alerted traders that bullish power was dissipating. The following session confirmed the pattern with the market gapping lower, closing well into the first candles white body. The market then pushed lower for a few sessions before finding support in the 105.00 region and bouncing from the lower trend channel boundary. Further confirmation was provided in the following session with the completion of a gravestone doji. The gravestone doji develops when the open, low, and close are at or near the low of the day. The profile of this doji, an extended upper shadow and close near the low of the session, demonstrates that bears were able to take control on the highs and force the market lower into the close. Slow-stochastics on the 30-year bond also support the retracement theme. A negative divergence developed on the last swing high with the oscillator failing to mirror the push to new highs. |
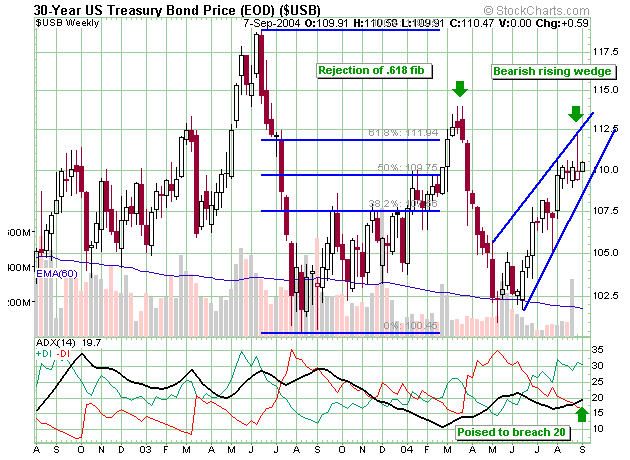
 Figure 2: Weekly chart of the US 30-year Treasury bond. The short-term trader may benefit from studying the longer-term weekly chart to gauge the overall profile of the 30-year bond if they are contemplating a bounce from the lower boundary of the daily trend channel. The market appears to be developing a bearish rising wedge on the weekly chart, which is marked by two converging trendlines and is distinguished by its slant. The 30-year bond has satisfied the "five touch" rule with three touches on the upper trendline and two on the lower trendline. The final touch or fifth point of the formation was marked with a shooting star candle. This candle has a small real body at the lower end of its range with a lengthy upper shadow and signifies that the market rejected higher prices. Bearish rising wedges usually unfold as a counter-rally to the long-term downtrend. Fibonacci levels are also helpful in monitoring retracements from a trend. The US 30-year bond also appears to struggling to overcome the important .618 Fibonacci retracement level of the sell-off from last year at 111.94. This level was rejected in March and more recently when the aforementioned shooting star was completed in the vicinity of that level. A push through the 20 level in the weekly ADX may trigger a sharp move and could coincide with a challenge of the lower bearish trendline. A break of the lower trendline would target the May low of 101. |
Chris Manuell spent 7 years as a futures sales/trader for a large investment bank and more recently as a technical analyst for an independent research company. He has a bachelor of economics and graduate diploma in applied finance & investment. Currently enrolled in the CMT program with the MTA.
| E-mail address: | chrismanuell5@yahoo.co.uk |
Click here for more information about our publications!
Comments
Date: 09/09/04Rank: 3Comment:
Date: 09/10/04Rank: 5Comment:
Date: 09/14/04Rank: 5Comment:

Request Information From Our Sponsors
- StockCharts.com, Inc.
- Candle Patterns
- Candlestick Charting Explained
- Intermarket Technical Analysis
- John Murphy on Chart Analysis
- John Murphy's Chart Pattern Recognition
- John Murphy's Market Message
- MurphyExplainsMarketAnalysis-Intermarket Analysis
- MurphyExplainsMarketAnalysis-Visual Analysis
- StockCharts.com
- Technical Analysis of the Financial Markets
- The Visual Investor
- VectorVest, Inc.
- Executive Premier Workshop
- One-Day Options Course
- OptionsPro
- Retirement Income Workshop
- Sure-Fire Trading Systems (VectorVest, Inc.)
- Trading as a Business Workshop
- VectorVest 7 EOD
- VectorVest 7 RealTime/IntraDay
- VectorVest AutoTester
- VectorVest Educational Services
- VectorVest OnLine
- VectorVest Options Analyzer
- VectorVest ProGraphics v6.0
- VectorVest ProTrader 7
- VectorVest RealTime Derby Tool
- VectorVest Simulator
- VectorVest Variator
- VectorVest Watchdog
