HOT TOPICS LIST
- MACD
- Fibonacci
- RSI
- Gann
- ADXR
- Stochastics
- Volume
- Triangles
- Futures
- Cycles
- Volatility
- ZIGZAG
- MESA
- Retracement
- Aroon
INDICATORS LIST
LIST OF TOPICS
PRINT THIS ARTICLE
by Jayanthi Gopalakrishnan
If you are at the right place at the right time, you can take advantage of good trades.
Position: Buy
Jayanthi Gopalakrishnan
PRINT THIS ARTICLE
DAY TRADING
Day Trading Basics, Part 3
05/19/00 02:53:18 PMby Jayanthi Gopalakrishnan
If you are at the right place at the right time, you can take advantage of good trades.
Position: Buy
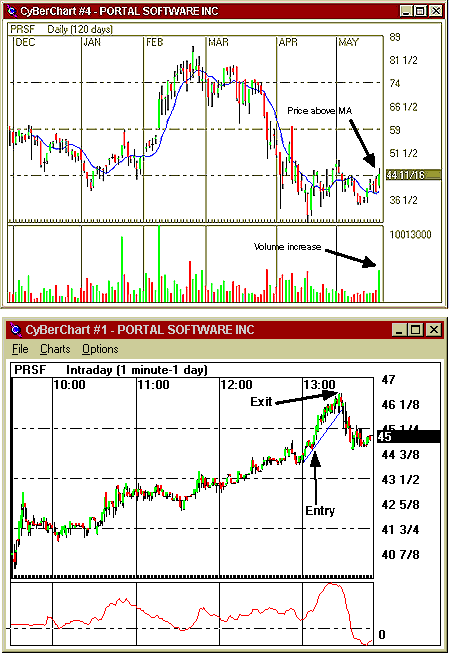
| At approximately 1:00 pm EST on May 19, 2000, I noticed PRSF on my 'top percent gainers' window. Noticing that the volume was in excess of 3 million, I brough up the daily and intraday charts (Figure 1). On the daily chart I could see a substantial increase in trading volume and that the prices were above their moving average, in this case, the 8-day moving average (MA). The only factor that was against the trade was the NASDAQ 100 futures chart which was trending down at this time. However, the potential for making a profitable long trade seemed promising. I then pulled up the intraday chart and noticed that an upward trend was beginning at 1:00 pm. I inserted the moving average convergence/divergence (MACD) indicator, the one I use to determine when to enter and exit a trade, and waited for a pullback before entering my long trade. A slight pullback occured at 13:05 at which point the MACD had also started ascending. Given these two factors, I entered my long position at $44.50. |
| I then drew a trendline from the point where the trend started to the low during the pullback and extended it. I placed a mental stop 1/8 point below the trendline. I would exit my position when the following two conditions were met: 1. The MACD had peaked and started reversing. 2. Prices started approaching the trendline. |

|
| Figure 1. Top chart: The daily chart of PRSF shows a substantial increase in trading volume on May 19, 2000. Prices were also above their moving average. Both are positive signs for entering a long position. Lower Chart: The intraday chart showing entry and exit positions for this trade. |
| Graphic provided by: Cybercorp. |
| |
| The MACD peaked at 13:18 pm and at 13:27 pm the prices started approaching the trendline. By this time he MACD had started reversing so I exited my position at $46.25 for a $1.75 point gain. |
| Title: | Editor |
| Company: | Technical Analysis of Stocks & Commodities |
| Address: | 4757 California Ave SW |
| Seattle, WA 98116 | |
| Website: | Traders.com |
| E-mail address: | Jayanthi@traders.com |
Traders' Resource Links | |
| Charting the Stock Market: The Wyckoff Method -- Books | |
| Working-Money.com -- Online Trading Services | |
| Traders.com Advantage -- Online Trading Services | |
| Technical Analysis of Stocks & Commodities -- Publications and Newsletters | |
| Working Money, at Working-Money.com -- Publications and Newsletters | |
| Traders.com Advantage -- Publications and Newsletters | |
| Professional Traders Starter Kit -- Software | |
Click here for more information about our publications!
Comments
Date: / /Rank: Comment: Most of the articles don t format well for printing on 8.5 x 11. Usually a grapg gets sliced in half. Most disconcerting.
Date: / /Rank: 4Comment: nice work! Thanks
Date: 04/12/08Rank: 5Comment:

Request Information From Our Sponsors
- VectorVest, Inc.
- Executive Premier Workshop
- One-Day Options Course
- OptionsPro
- Retirement Income Workshop
- Sure-Fire Trading Systems (VectorVest, Inc.)
- Trading as a Business Workshop
- VectorVest 7 EOD
- VectorVest 7 RealTime/IntraDay
- VectorVest AutoTester
- VectorVest Educational Services
- VectorVest OnLine
- VectorVest Options Analyzer
- VectorVest ProGraphics v6.0
- VectorVest ProTrader 7
- VectorVest RealTime Derby Tool
- VectorVest Simulator
- VectorVest Variator
- VectorVest Watchdog
- StockCharts.com, Inc.
- Candle Patterns
- Candlestick Charting Explained
- Intermarket Technical Analysis
- John Murphy on Chart Analysis
- John Murphy's Chart Pattern Recognition
- John Murphy's Market Message
- MurphyExplainsMarketAnalysis-Intermarket Analysis
- MurphyExplainsMarketAnalysis-Visual Analysis
- StockCharts.com
- Technical Analysis of the Financial Markets
- The Visual Investor
