HOT TOPICS LIST
- MACD
- Fibonacci
- RSI
- Gann
- ADXR
- Stochastics
- Volume
- Triangles
- Futures
- Cycles
- Volatility
- ZIGZAG
- MESA
- Retracement
- Aroon
INDICATORS LIST
LIST OF TOPICS
PRINT THIS ARTICLE
by Koos van der Merwe
Sol Kerzner turned a small area in South Africa into a paradise called SUN CITY. His casinos, hotels and theatres were fairytale fantasies visited by millions. His Bahamas Paradise Island, home to the Atlantis Hotel Resort is his attempt to create Paradise in the Bahamas. How successful is he? A look at a chart tells us all.
Position: Hold
Koos van der Merwe
Has been a technical analyst since 1969, and has worked as a futures and options trader with First Financial Futures in Johannesburg, South Africa.
PRINT THIS ARTICLE
MA ENVELOPES
Kerzner International Ltd.
09/07/04 02:11:25 PMby Koos van der Merwe
Sol Kerzner turned a small area in South Africa into a paradise called SUN CITY. His casinos, hotels and theatres were fairytale fantasies visited by millions. His Bahamas Paradise Island, home to the Atlantis Hotel Resort is his attempt to create Paradise in the Bahamas. How successful is he? A look at a chart tells us all.
Position: Hold
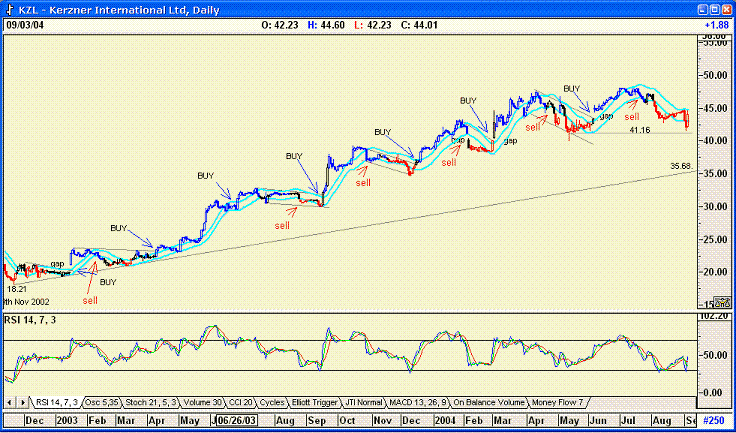
| The daily chart, shows how the share price rose from $18.21 in November 2002 to $44.01 today. Yes there were bumps along the way, but growth has been steady. In the chart I am using a JM internal band to monitor the share. |
| A JM internal band line in a 15-period moving average offset by 2% in either direction. A buy signal is given when the closing price breaks decisively above the upper band, and a sell signal is given when the closing price breaks decisively below the lower band. Often a price may fall to test the lower band, but not give a sell signal, and vice versa should the trend be downward. In the chart you can see how the price has broken above the upper JM band line, more than often after a period of consolidation. The 14-period RSI indicator acted as a confirmatory signal should there be any doubt. |

|
| Kerzner International, and the magic of Sol. |
| Graphic provided by: AdvancedGET. |
| |
| The chart also shows the XTL indicator, a Advance GET indicator. The XTL (eXpert Trend Locator) Parameter uses a statistical evaluation of the market that can tell the difference between random market swings (noise) and directed market swings (trends). The indicator colors the bars: Up is blue, down is red, and black is neutral. The color of the bars can be used to further identify a trend. Note on the chart how often the color changed as the price moved below the lower JM band, giving a sell signal. |
| At present the share price is down, testing support at $41.16 However, the RSI indicator is looking promising, and suggesting future strength. Should the share fall below the $41.16 level, it would look for support at $35.68. |
| I would wait to see what the trend for the share is. However any move above the upper JM band line, would be a strong buy signal. |
Has been a technical analyst since 1969, and has worked as a futures and options trader with First Financial Futures in Johannesburg, South Africa.
| Address: | 3256 West 24th Ave |
| Vancouver, BC | |
| Phone # for sales: | 6042634214 |
| E-mail address: | petroosp@gmail.com |
Click here for more information about our publications!
Comments
Date: 09/09/04Rank: 2Comment:
Date: 09/12/04Rank: 3Comment:

Request Information From Our Sponsors
- StockCharts.com, Inc.
- Candle Patterns
- Candlestick Charting Explained
- Intermarket Technical Analysis
- John Murphy on Chart Analysis
- John Murphy's Chart Pattern Recognition
- John Murphy's Market Message
- MurphyExplainsMarketAnalysis-Intermarket Analysis
- MurphyExplainsMarketAnalysis-Visual Analysis
- StockCharts.com
- Technical Analysis of the Financial Markets
- The Visual Investor
- VectorVest, Inc.
- Executive Premier Workshop
- One-Day Options Course
- OptionsPro
- Retirement Income Workshop
- Sure-Fire Trading Systems (VectorVest, Inc.)
- Trading as a Business Workshop
- VectorVest 7 EOD
- VectorVest 7 RealTime/IntraDay
- VectorVest AutoTester
- VectorVest Educational Services
- VectorVest OnLine
- VectorVest Options Analyzer
- VectorVest ProGraphics v6.0
- VectorVest ProTrader 7
- VectorVest RealTime Derby Tool
- VectorVest Simulator
- VectorVest Variator
- VectorVest Watchdog
